Marine incident trends
In 2023 AMSA received a total of 4061 reports of marine incidents from Foreign Flagged (FF) vessels. This represents a 5.6% increase from 2022 (3847 incidents). 6.6% (270) of all incidents in 2023 were classified as very serious or serious, which is an increase from 4.9% (190) in 2022 (Figure 25).
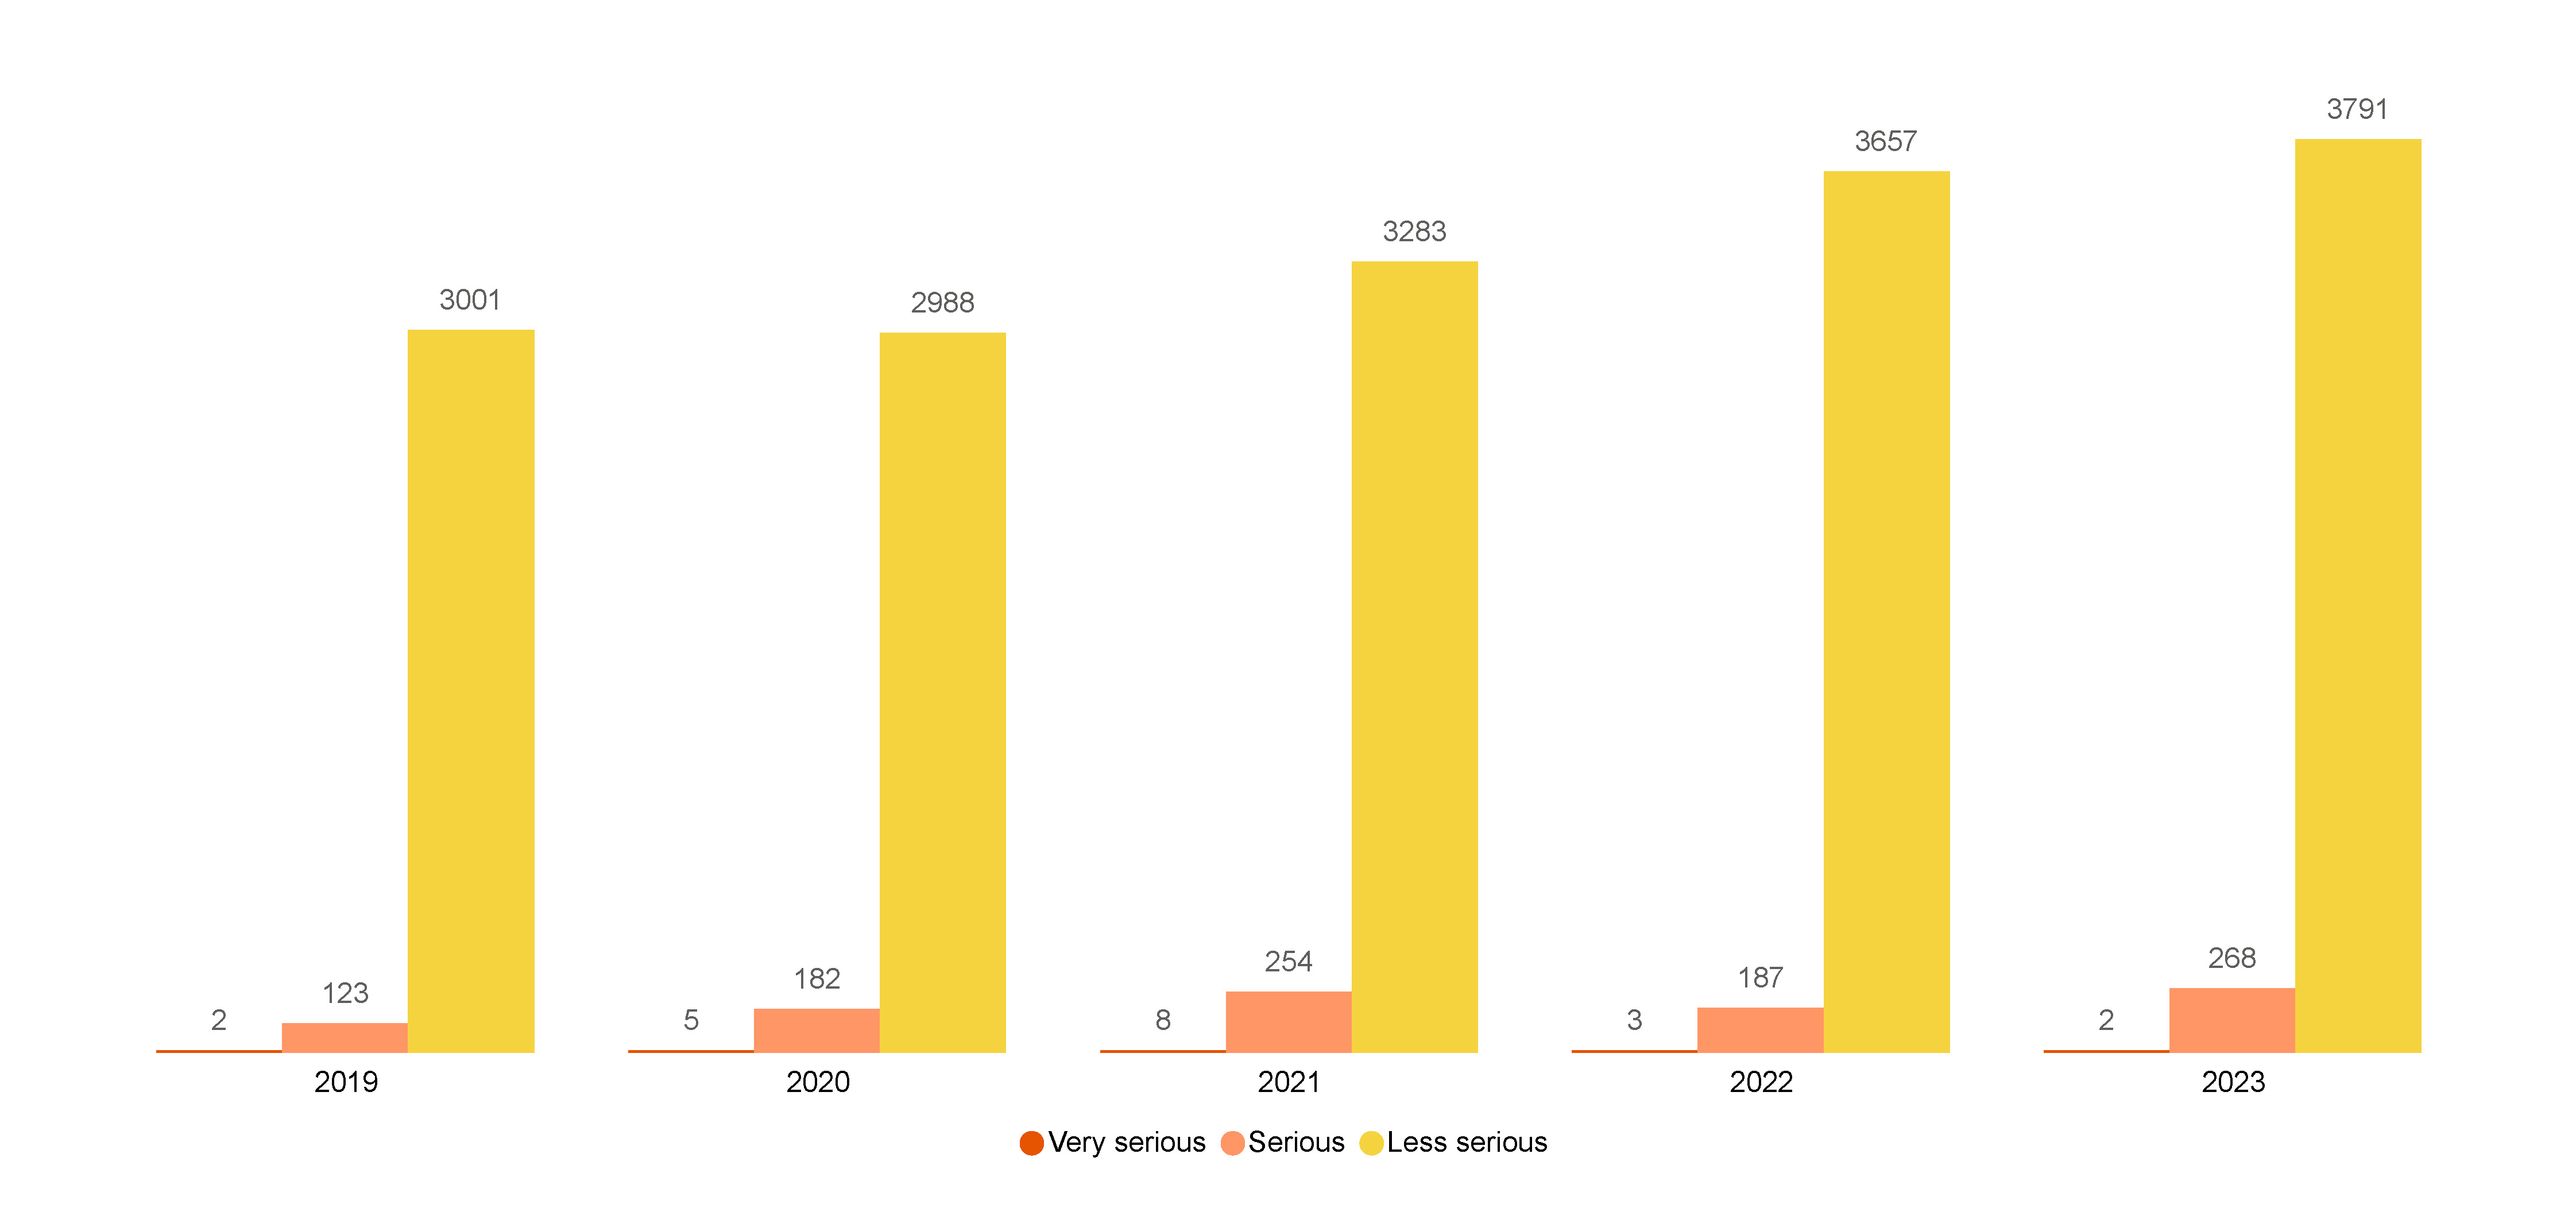
Figure 25 Marine incidents reported by severity (2019-2023)
Consistent with port arrivals data1 most marine incident reports from foreign flagged vessels in 2023 were from bulk carriers. Bulk carriers, which account for 53.8% of foreign flag arrivals, reported 60.4% of incidents in 2023 (Figure 26). Container vessels, which account for 15.5% of foreign flag arrivals, reported 14.7% of incidents in 2023. Similarly, general cargo/multi-purpose vessels accounted for 6.7% of arrivals and reported 6.0% of incidents.
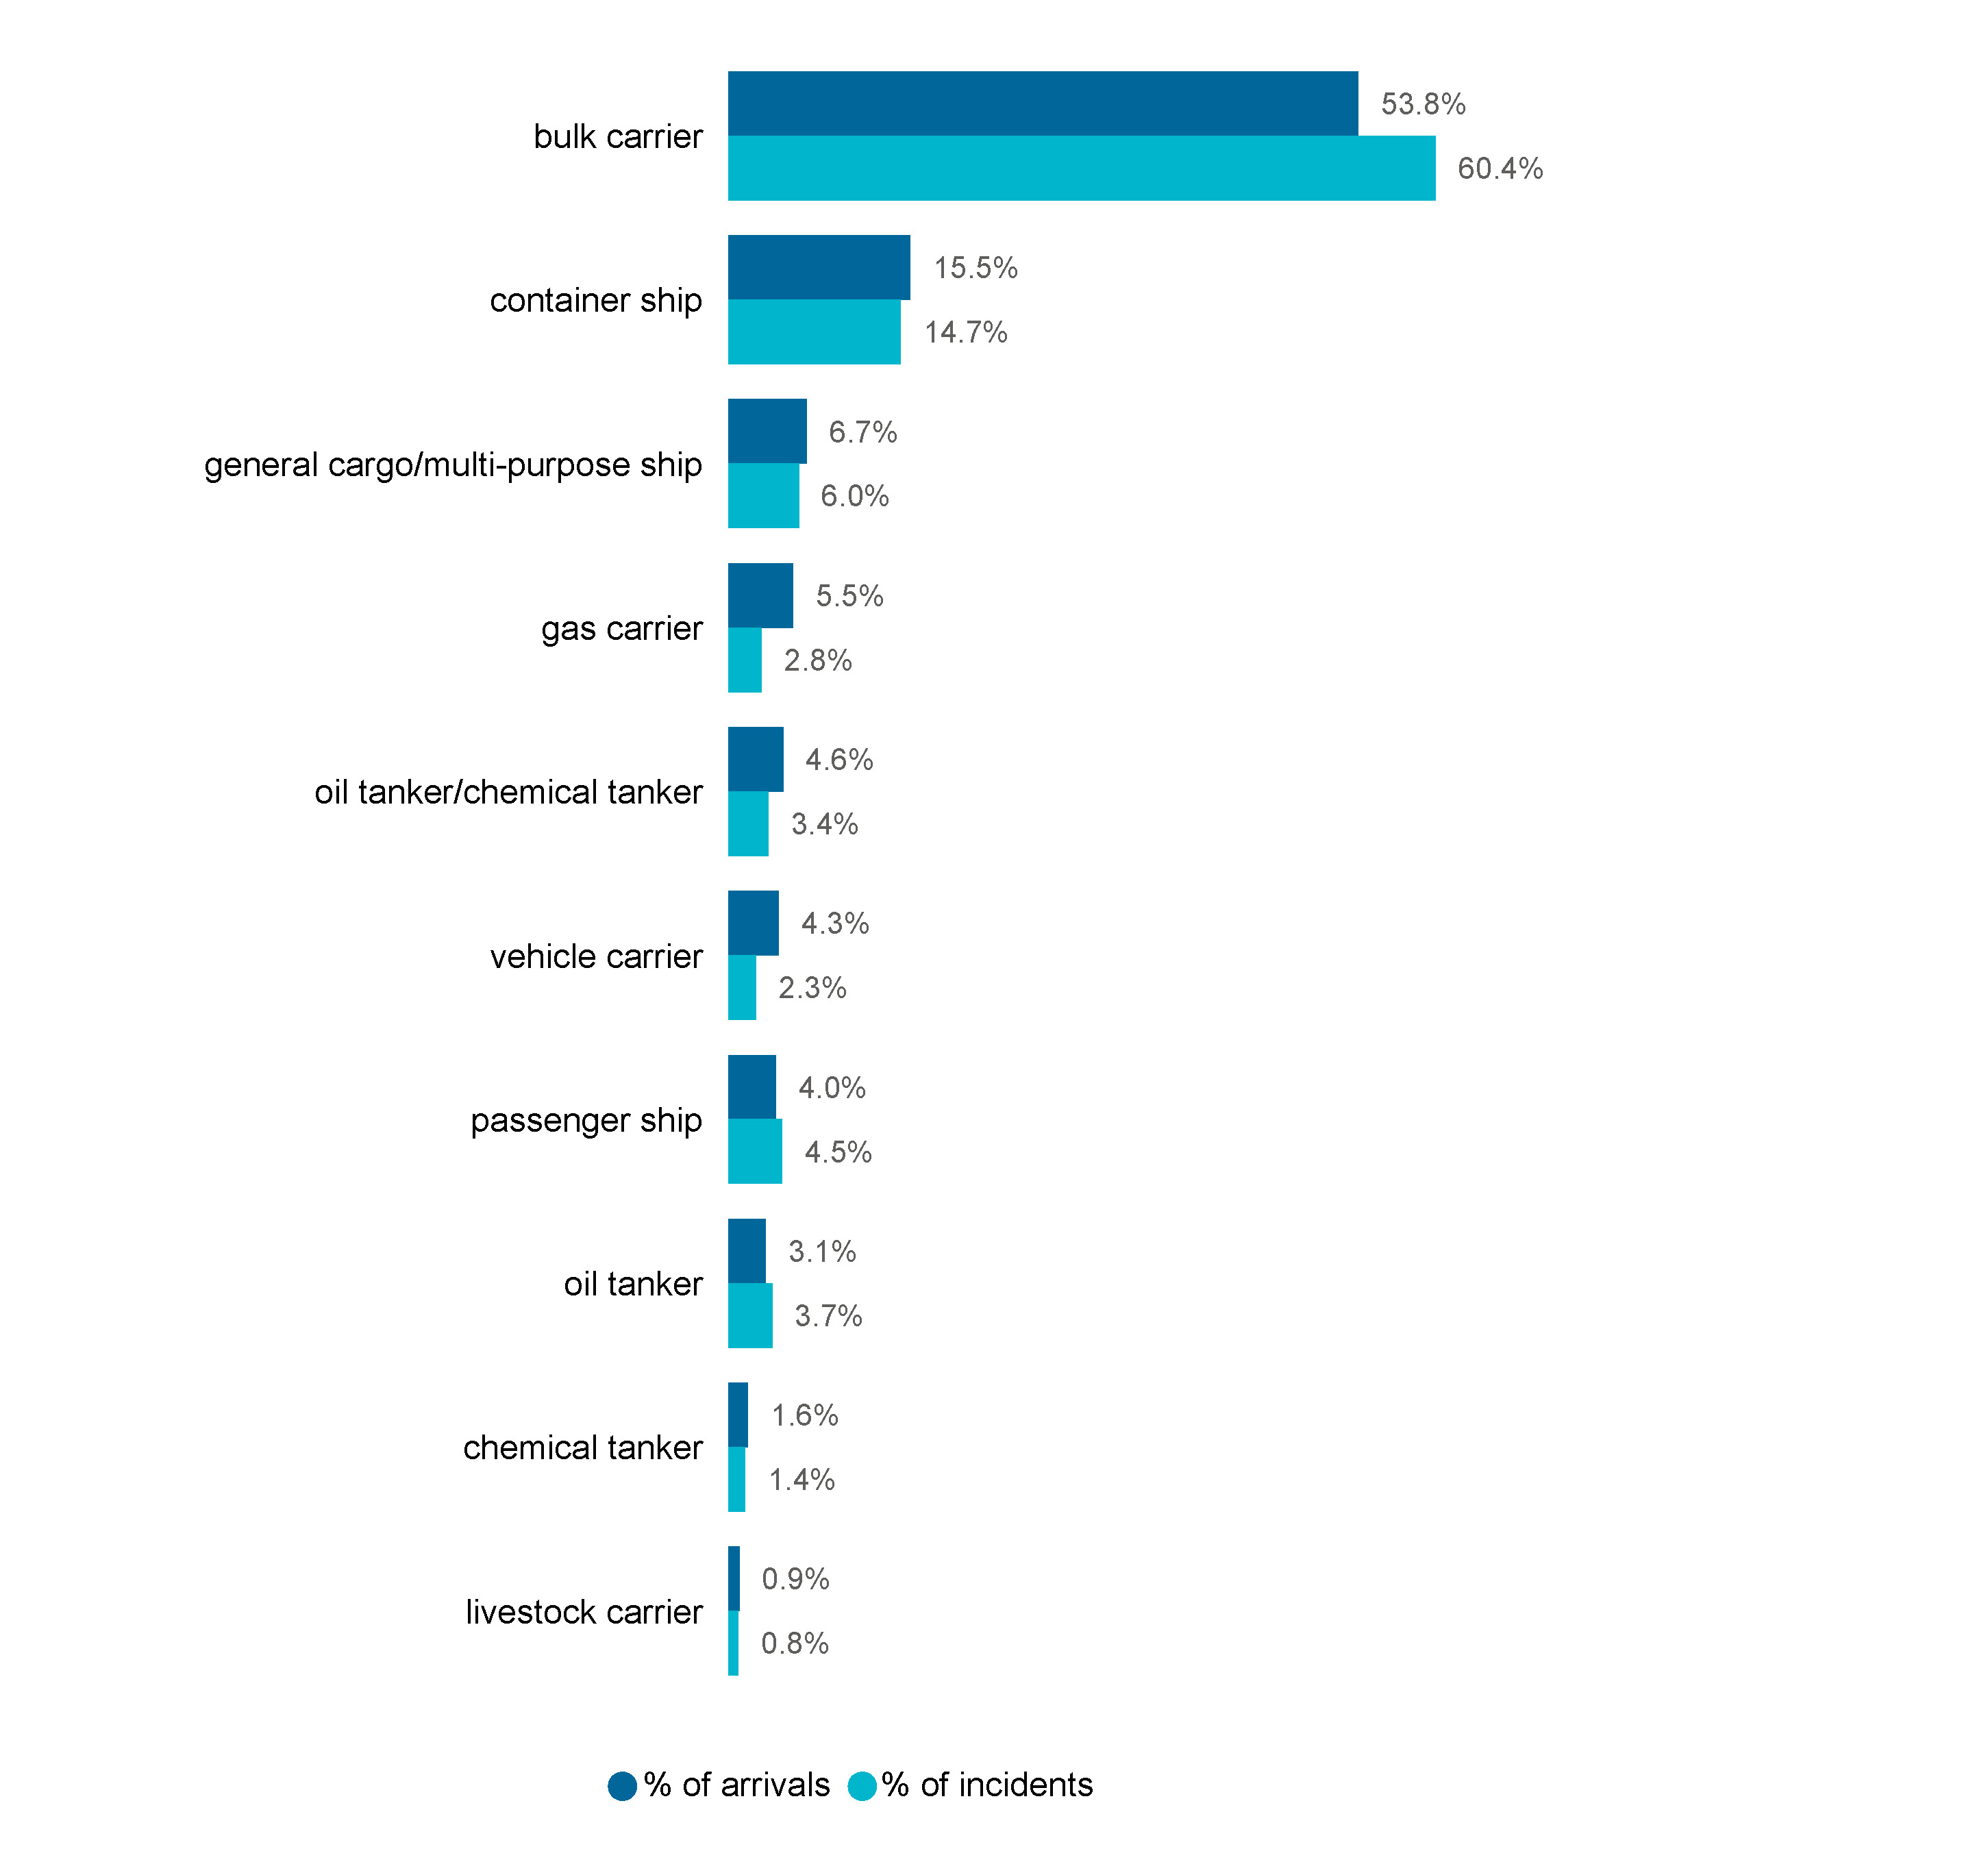
Figure 26 Proportion of foreign flag vessel incidents and vessel arrivals in 2023 by vessel type
Consequences to people
Consequence refers to the impact or outcome of a marine incident, and may include consequences to the vessel, persons on the vessel, the environment, or infrastructure. This section focuses on people consequences, including fatalities and injuries.
Fatalities
In 2023 there was one operational related seafarer fatality and three person overboard fatalities on foreign flagged vessels. There were no passenger fatalities reported in 2023.
Detailed reporting on vessel crew fatalities is contained in the Maritime Labour Convention Annual Report 2023 .2
Injuries
In 2023, a total of 286 injuries of crew and passengers were reported from RAVs (36) and foreign flag (250) vessels (Table 3). There were 93 passenger injuries for foreign flagged vessels, comprising 2.3% of incidents. However, these injuries include:
- injuries from recreational activities (such as sport and entertainment),
- injuries from slips, trips and falls not attributable to access, operations or handling of the vessel,
- when a person deliberately threatens or harms another person onboard.
Table 3 Incidents that include a reported injury to a crew member or passenger, total and as a proportion of all incidents 2019-2023.
| Year | 2019 | 2020 | 2021 | 2022 | 2023 | ||||||
|---|---|---|---|---|---|---|---|---|---|---|---|
| Total | % of Incidents | Total | % of Incidents | Total | % of Incidents | Total | % of Incidents | Total | % of Incidents | ||
| RAV | Crew injury | 42 | 16.3% | 68 | 20.1% | 54 | 16.9% | 49 | 13.3% | 33 | 12.4% |
| Passenger injury | 2 | 0.8% | 1 | 0.3% | 4 | 1.3% | 1 | 0.3% | 3 | 1.1% | |
| FF | Crew injury | 187 | 6.0% | 135 | 4.3% | 163 | 4.6% | 129 | 3.4% | 157 | 3.9% |
| Passenger injury | 102 | 3.3% | 24 | 0.8% | 1 | 0.0% | 18 | 0.5% | 93 | 2.3% | |
Most injuries were associated with maintenance activities (42.0% (63)) with 18.7% (28) of these being serious. Cargo and stores handling was the next largest source of injuries at 24.7% (37), with the majority (22) of these being serious (Figure 27, Table A8).
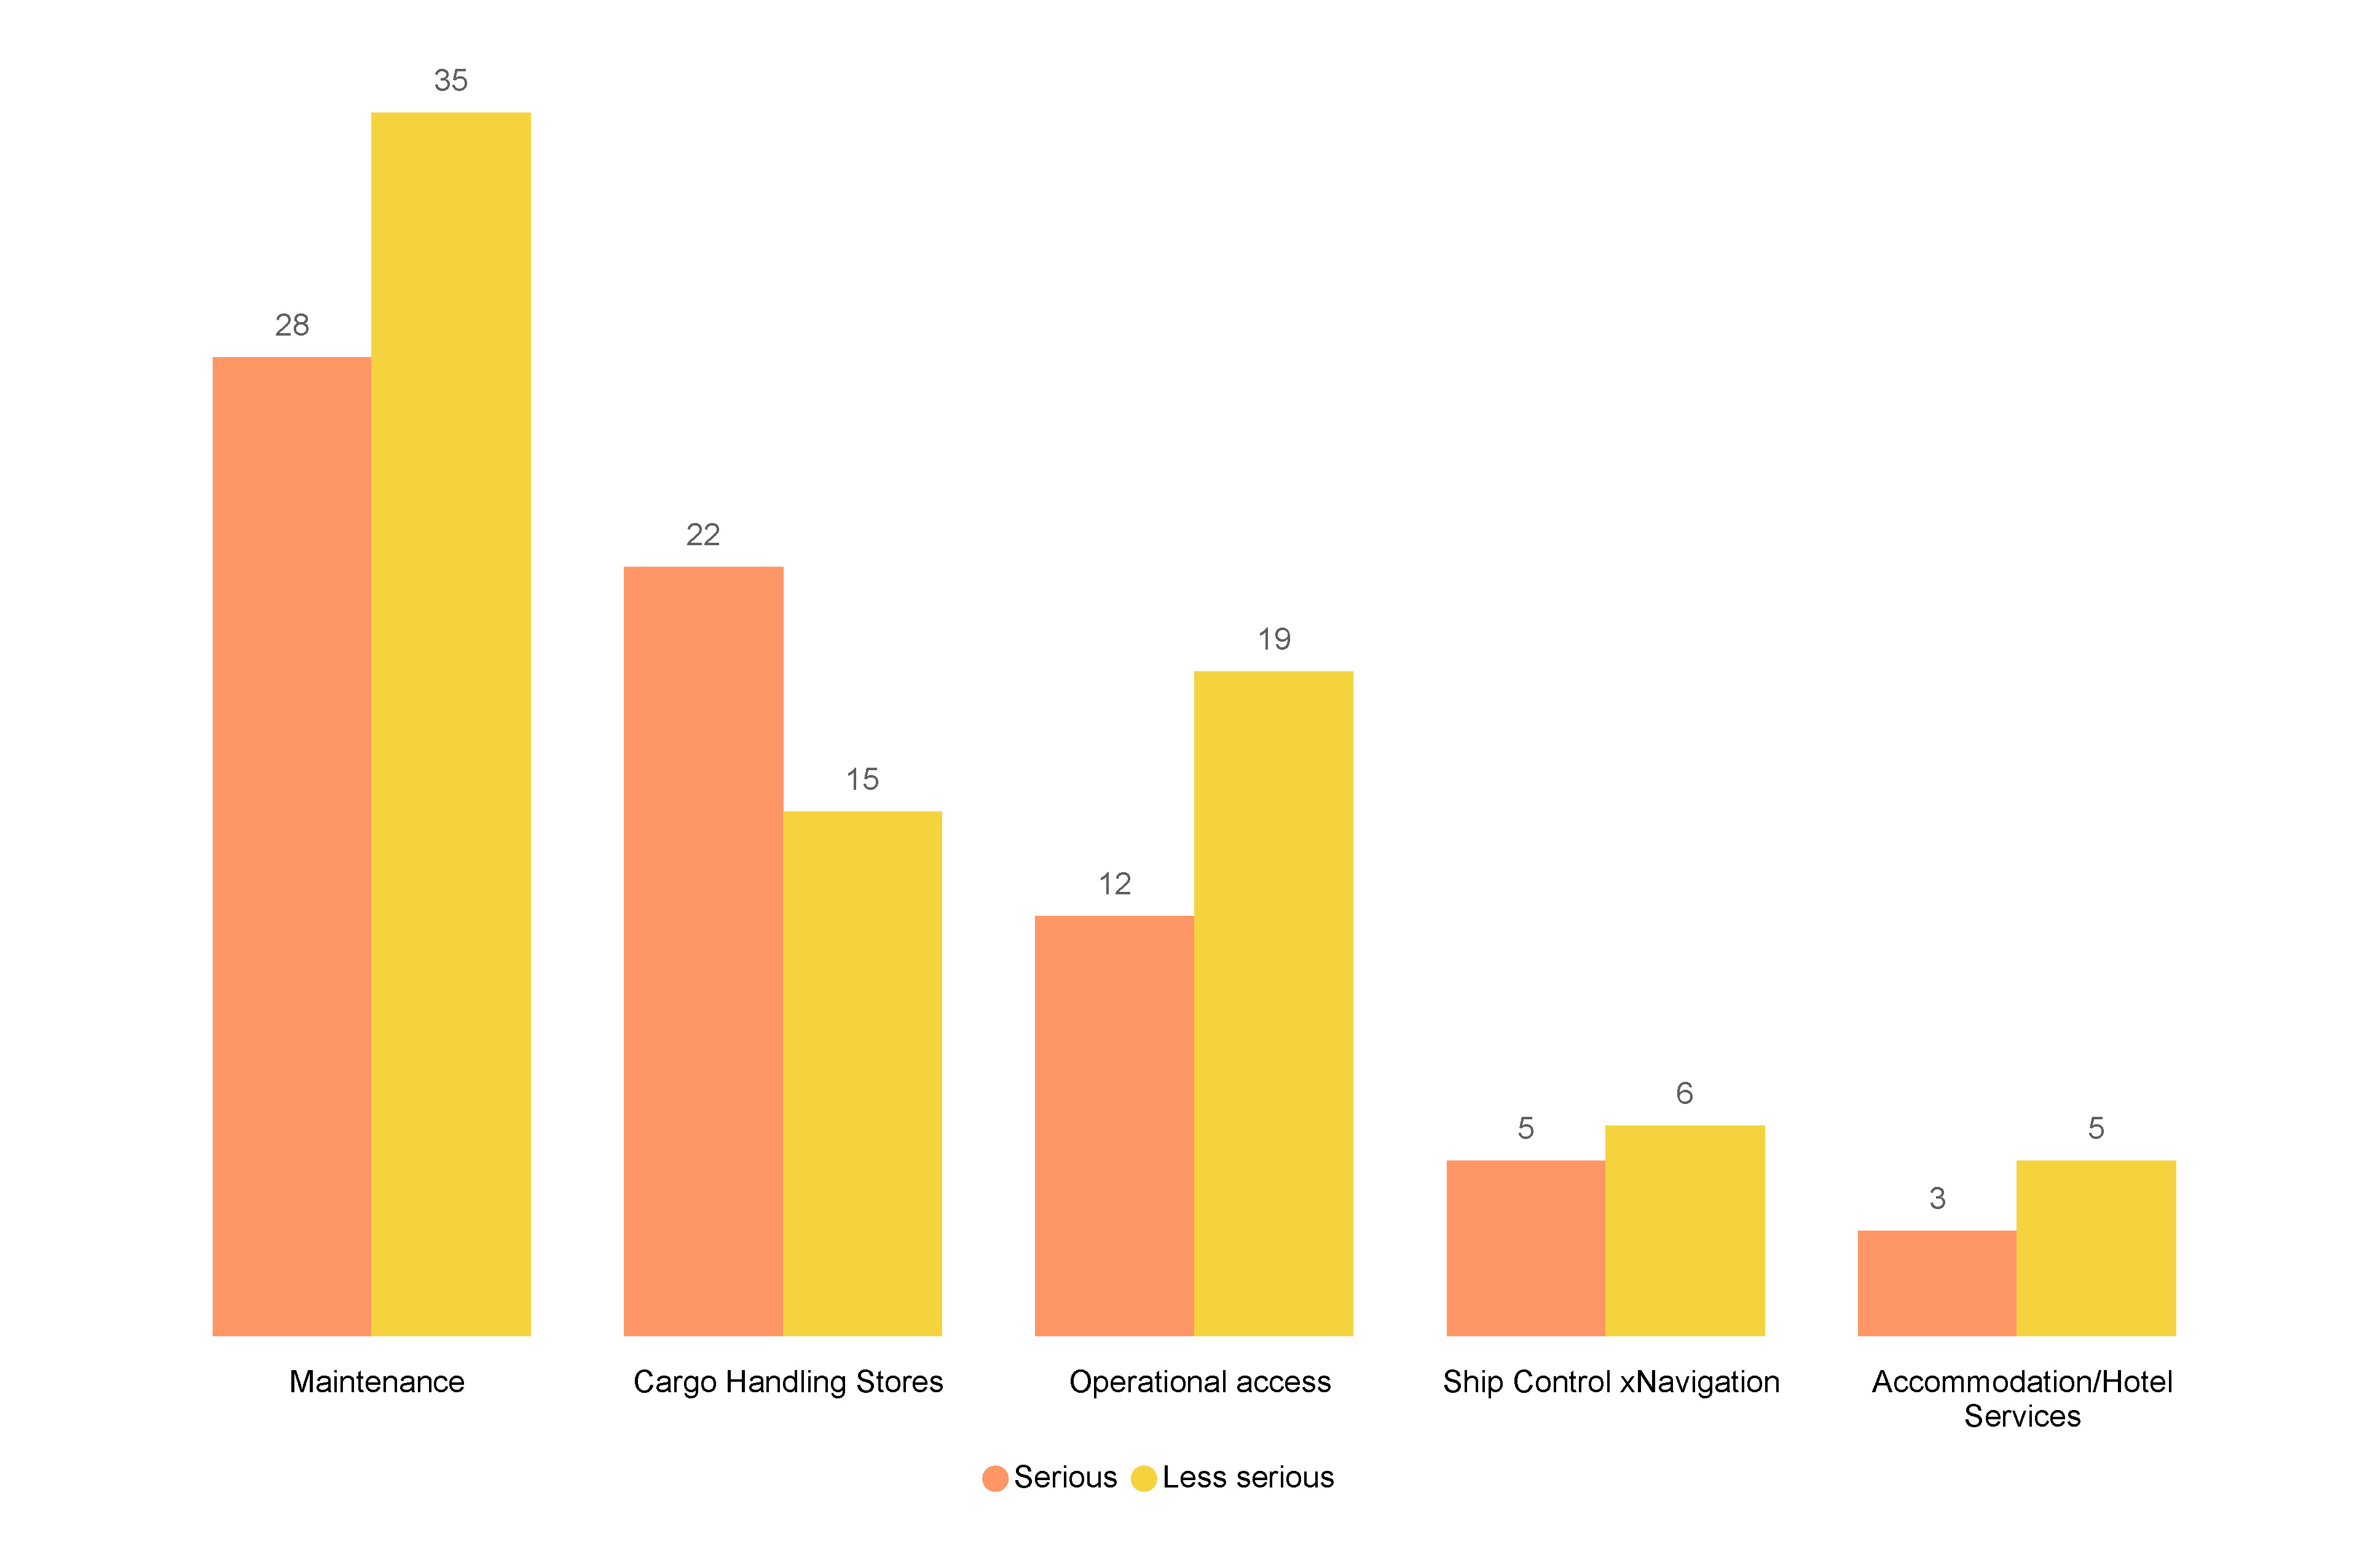
Figure 27 Tasks associated with crew injury by incident severity, FF, and RAV (2023)
Persons overboard
In 2023, 10 persons overboard incidents were reported with 5 of these associated with the operation of the vessel. These involved:
- Two incidents in which persons fell into the water when transferring between a foreign flagged vessel and a pilot vessel.
- A crew member fell overboard while preparing the gangway.
- A spring line parted, knocking a crew member overboard.
Consequences to vessels
Vessel consequences are the impacts or outcomes to the vessel itself resulting from a marine incident, such as damage, disablement, system impairment or loss. In 2023, 4.63% (188) of incidents reported involved a vessel consequence. 61 of these were serious.
Figure 29 shows the most frequently occurring vessel consequences between 2020 and 2023 by year. In 2023, contact with things other than another vessel (35) continues to make up most vessel consequences, followed by close quarter consequences at 22 incidents, although this consequence has fluctuated significantly between 2020 and 2023.
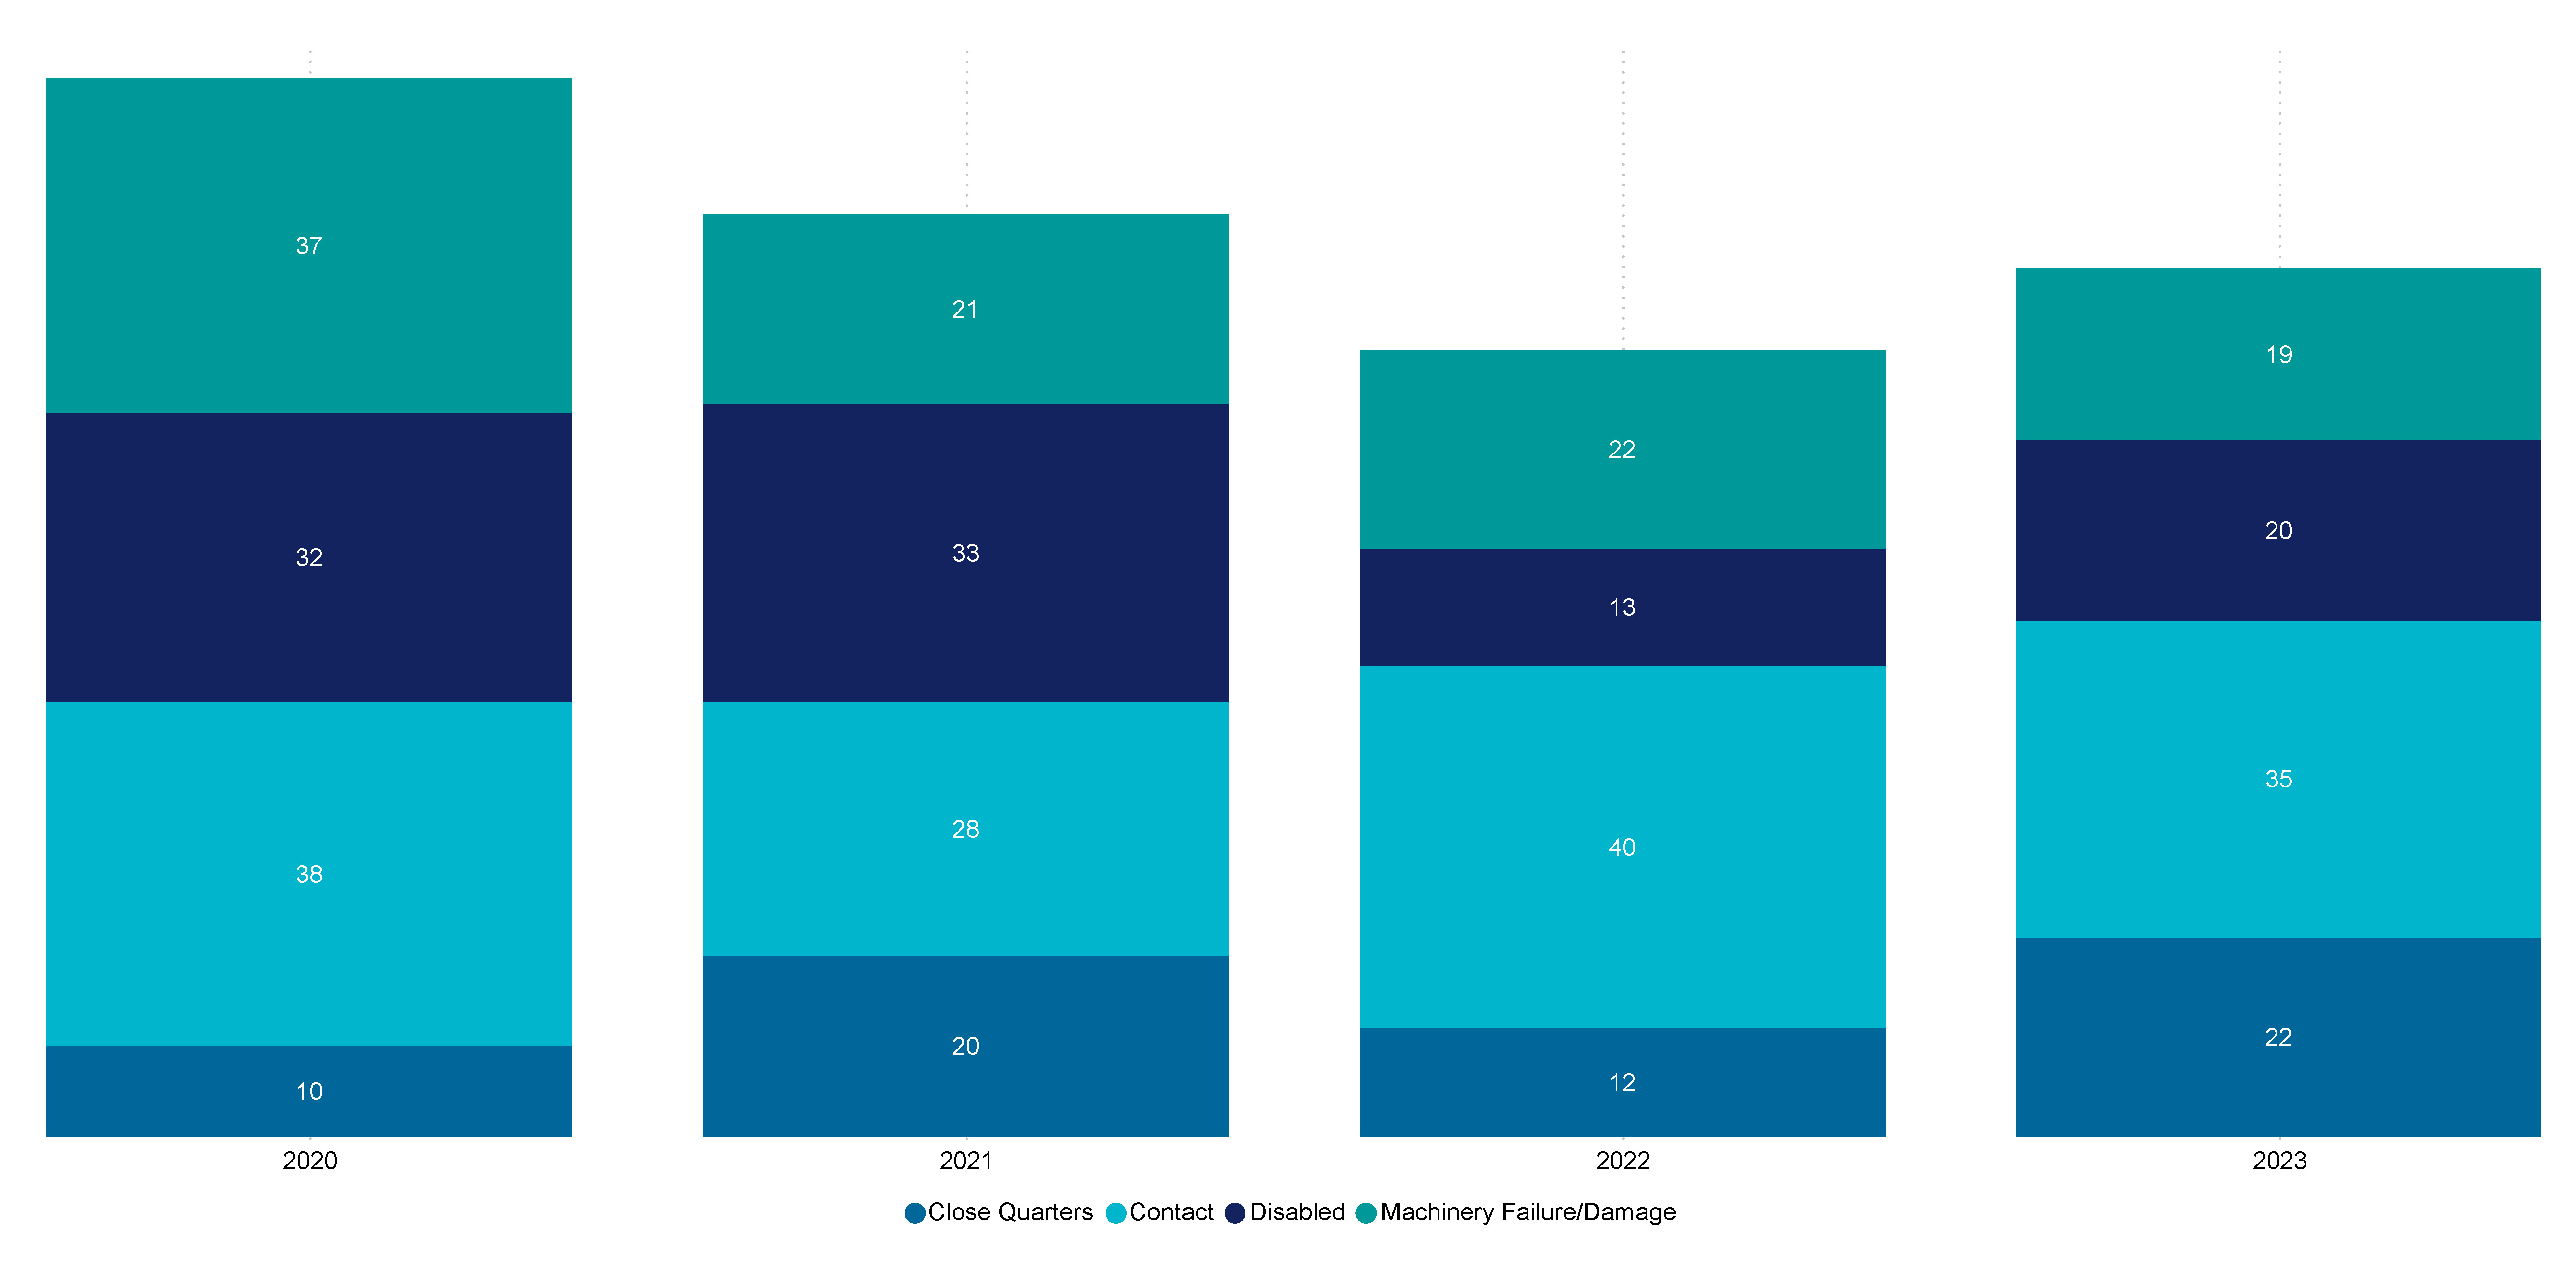
Figure 29 Top 6 vessel consequences, FF and RAV (2020-23)
Figure 30 shows technical/operational failures associated with vessel consequence incidents by severity, for 2023. Most failures attributable to vessel consequences were associated with cargo and stores handling (28.1% (102)), with 30.4% (31) of these incidents categorised as serious.
Maintenance, the second highest consequence, was associated with 22.0% (80) of vessel consequences, with 42.5% of these incident types being serious and 1.3% (1) being very serious.
While power, propulsion and steering failures was associated with 14.0 % of vessel consequences, this issue continues to present a major concern to vessel safety.
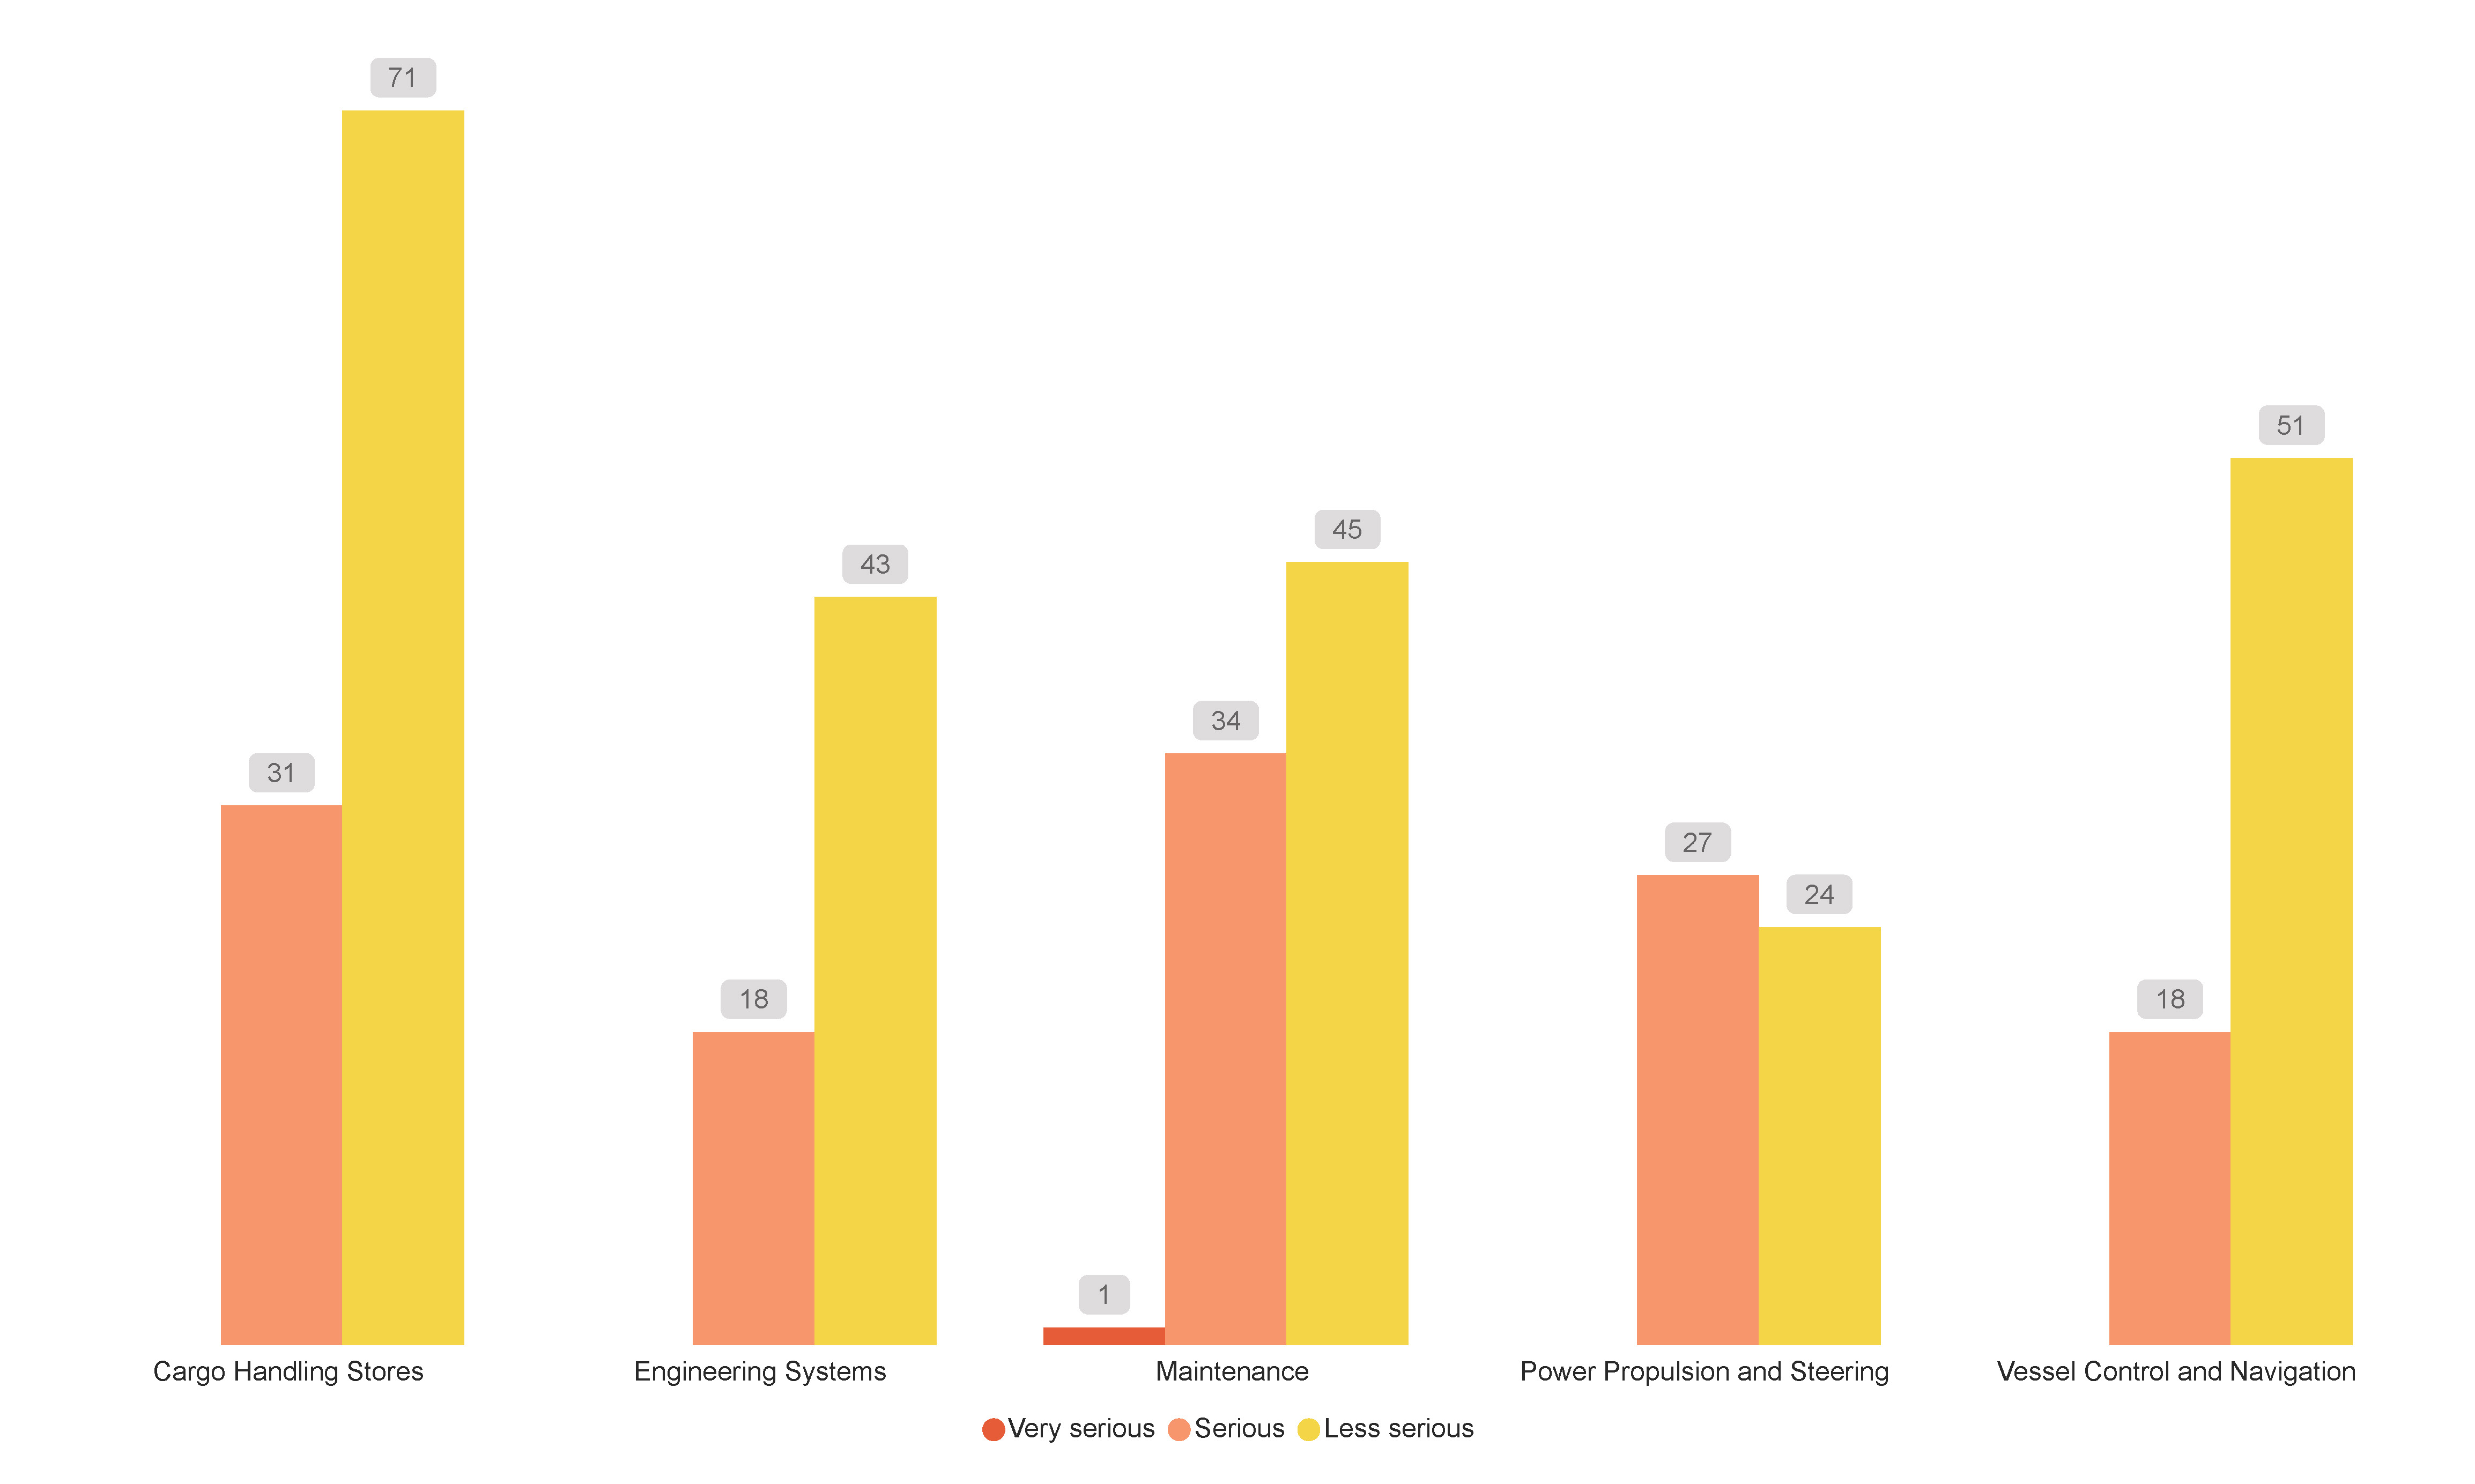
Figure 30 Technical/Operational failures associated with vessel consequence incidents by severity, FF and RAV (2023)
Trends in Technical occurrence types
Figure 31 shows the most frequently technical occurrence types between 2019 and 2023.
In 2023, vessel system failures (687) comprised the majority of technical occurrence types increasing by 3.0 % from 2022 (667).
This is followed by engineering systems with 652 technical occurrence type in 2023, representing an increase of 28.3% from 2022 (508). Power propulsion and steering included the third most frequent occurring technical failures in 2023 (646), declining by 2.6% from 2022 (663).
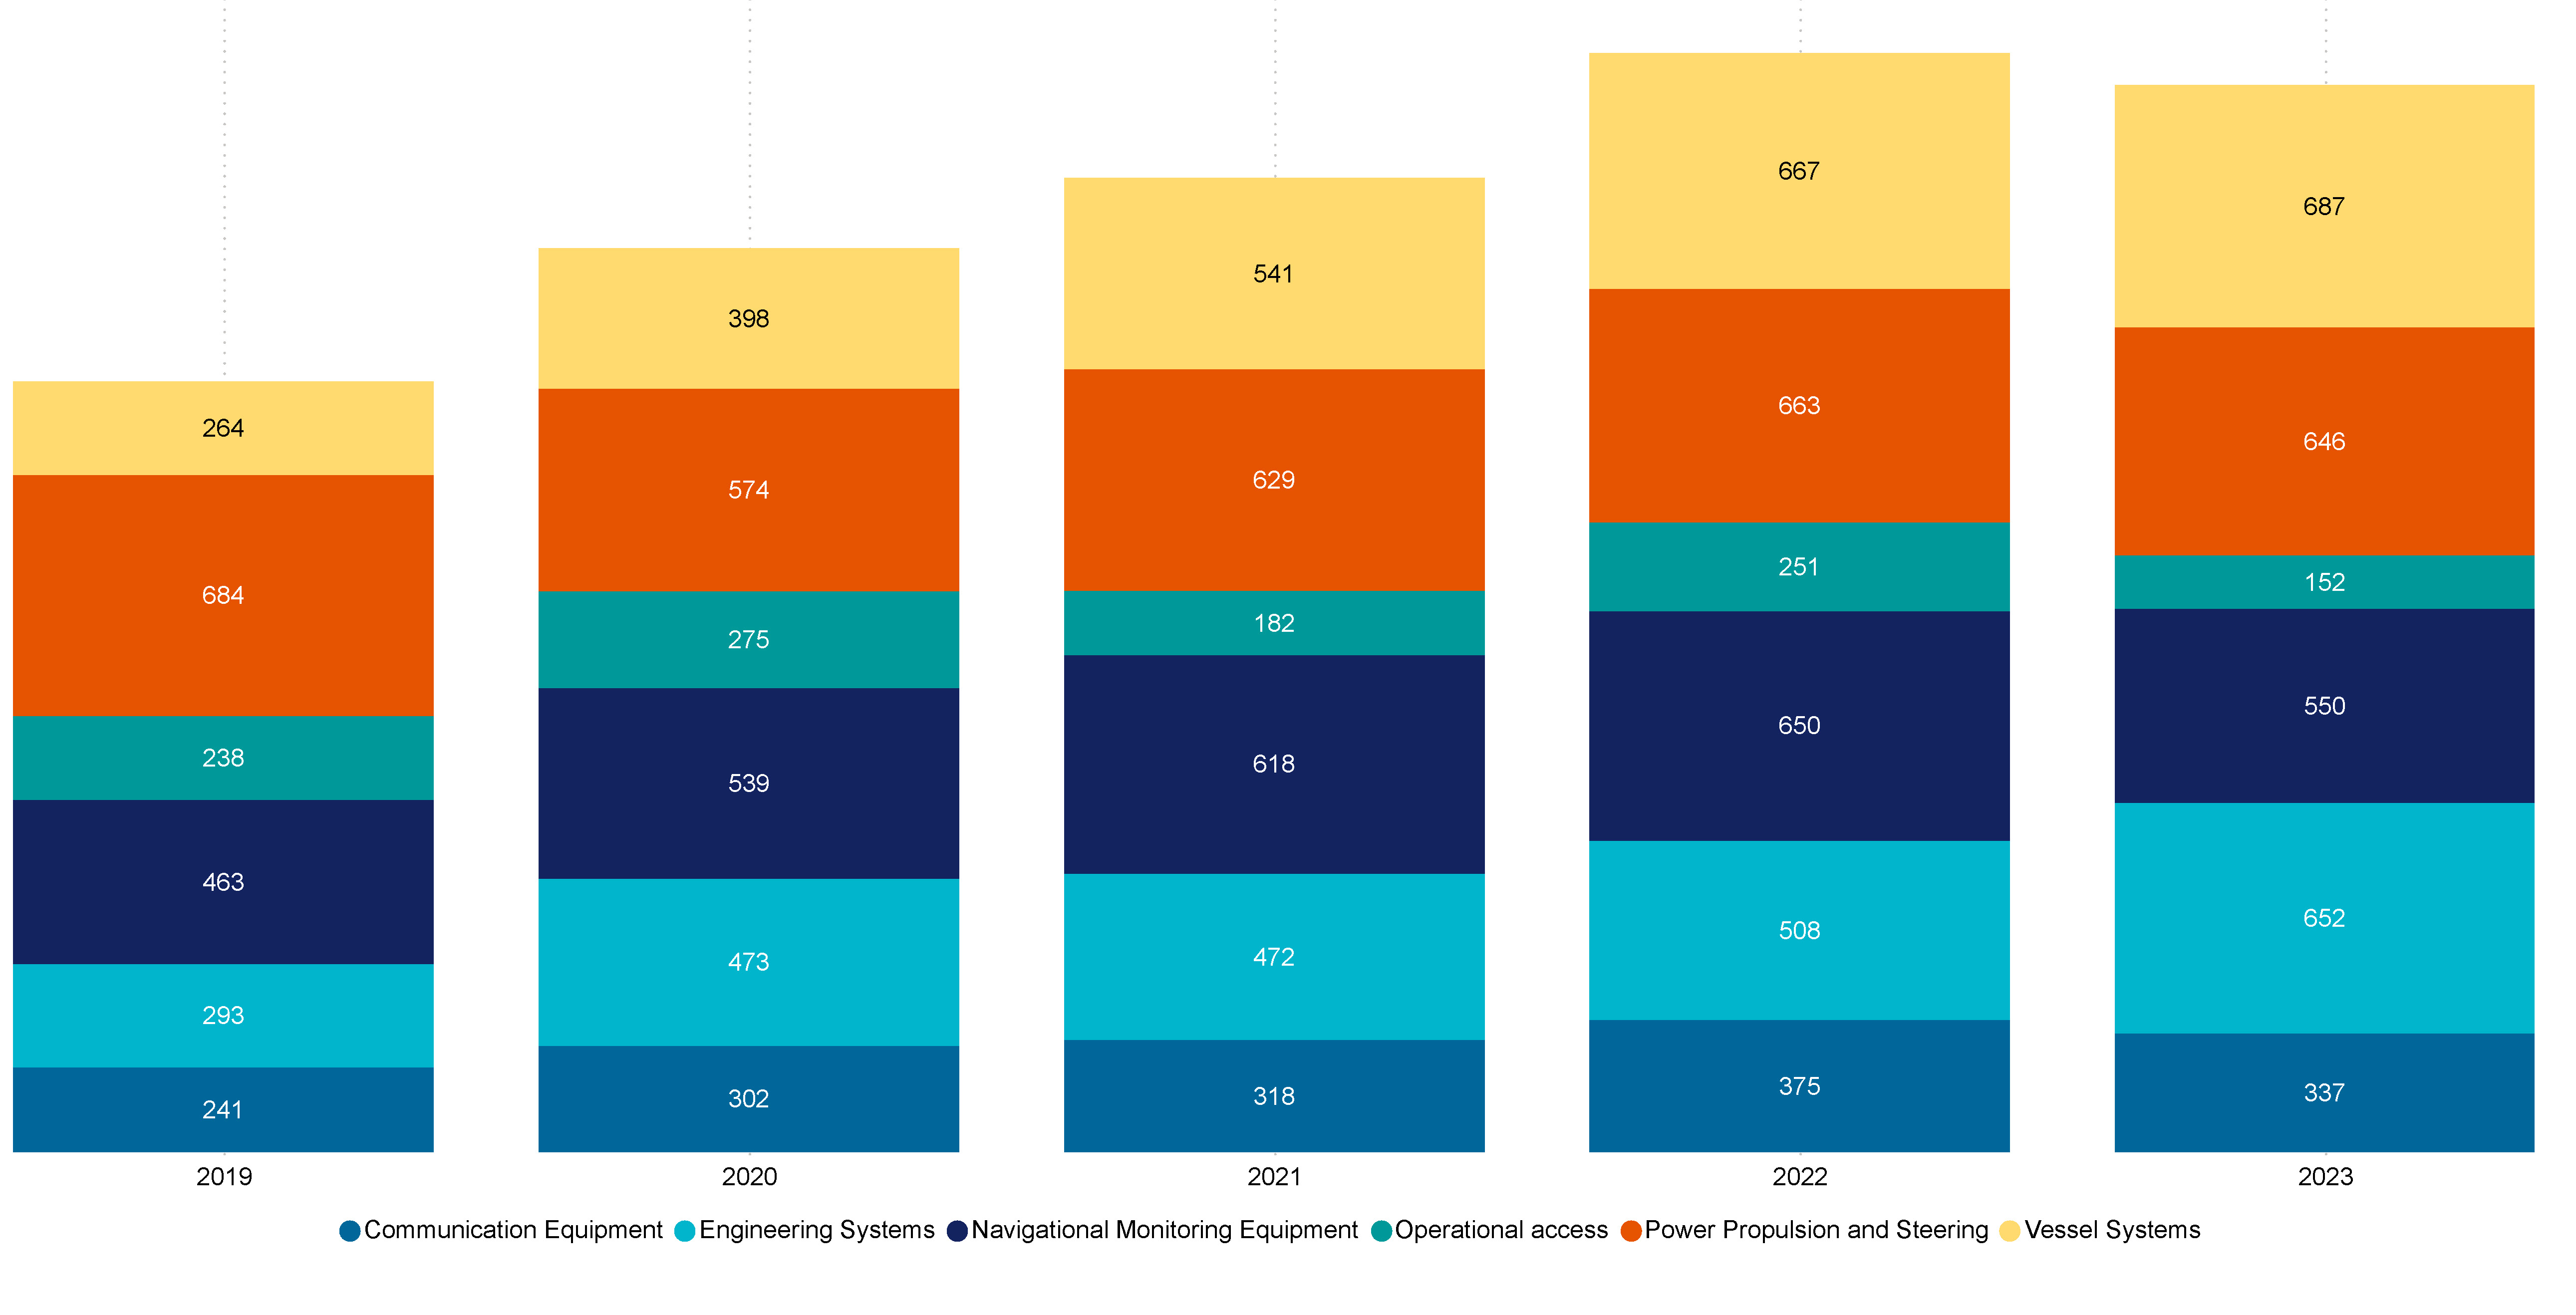
Figure 31 Top 6 technical occurrence types, FF and RAV (2019–2023)
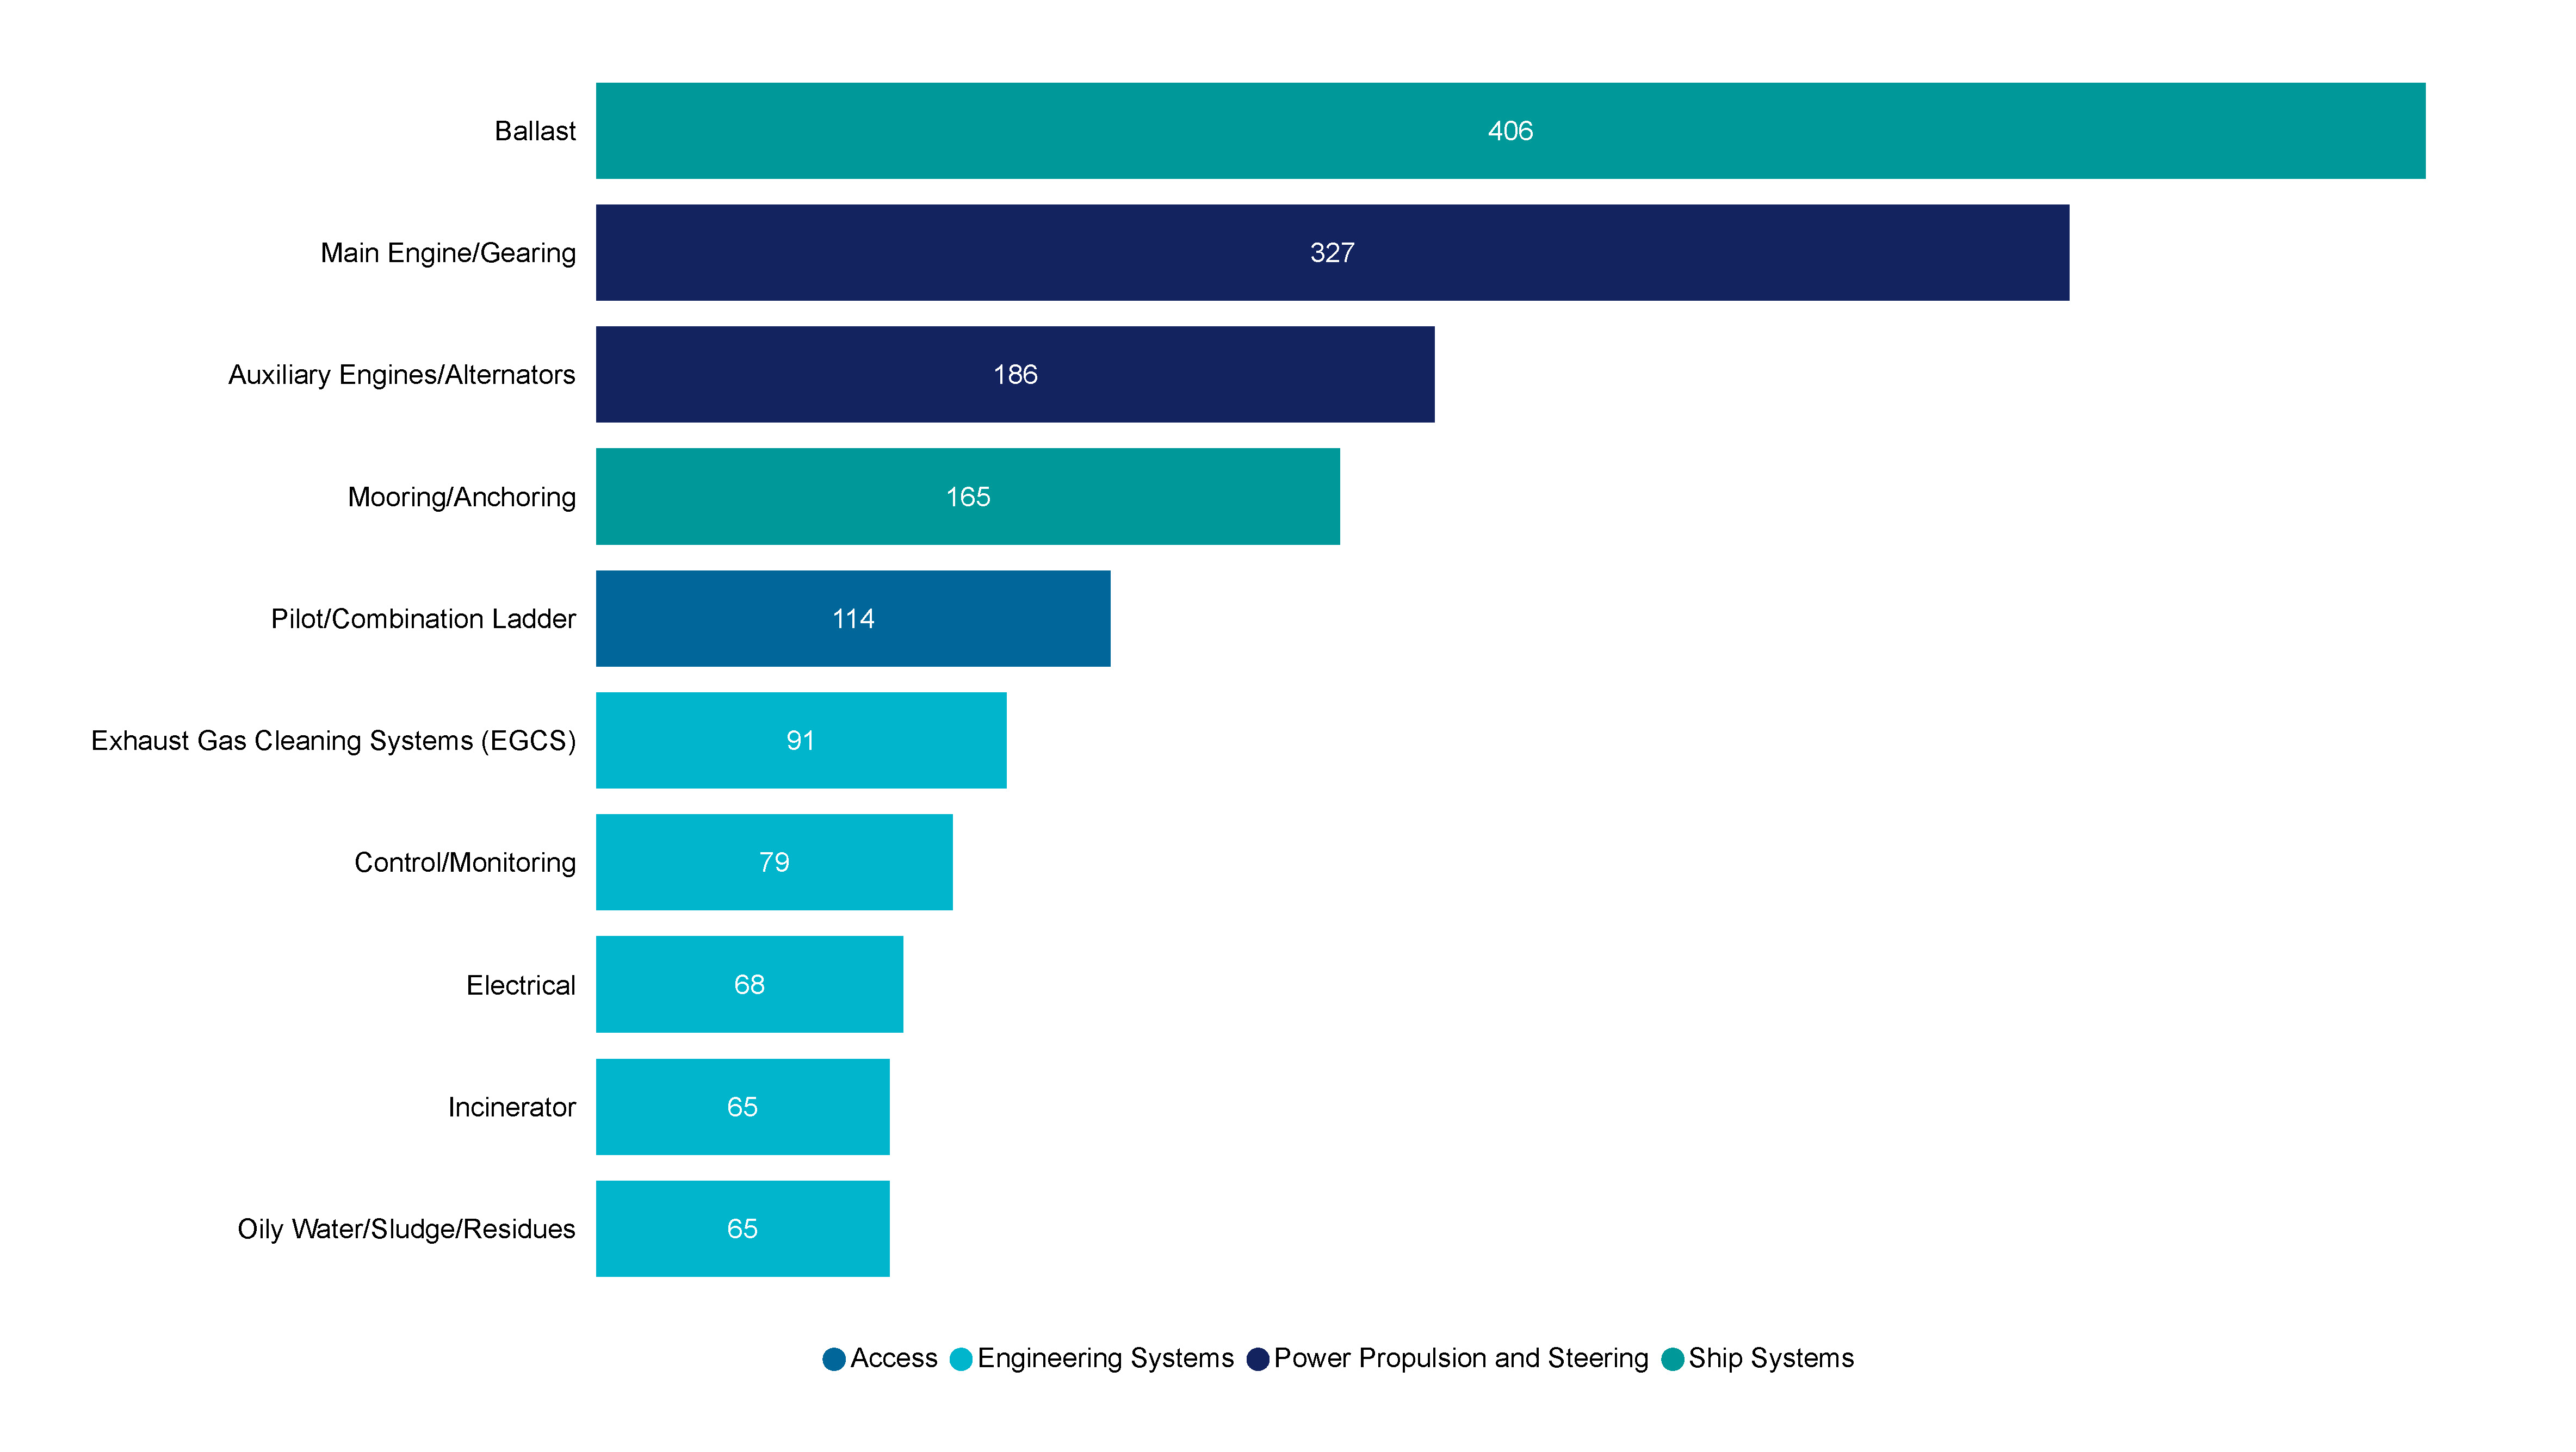
Figure 32 shows the top 10 failures in equipment associated with vessel systems, power, propulsion and steering, engineering systems, and access in 2023.
Vessel systems included ballast system related failures which occurred the most frequently (406 occurrences). In terms of power, propulsion and steering, this graph indicates the relative frequency of occurrence of main engine/gearing and auxiliary engines/alternators compared to other equipment and machinery failures on board these vessels.
Trends in Operational occurrence types
Figure 34 shows the most frequently occurring operational occurrence types between 2019 and 2023.
In 2023, cargo and stores handling occurrences increased by 136.4% from 2022 (88 in 2022 to 208 in 2023). Vessel control and navigation was the second most frequent operational occurrence type, increasing by 24.5% from 102 in 2022 to 127 in 2023.
This was followed by maintenance being third largest operational occurrence, increasing by 54%, from 73 in 2022 to 113 in 2023.
Communication related failures, while the fifth most common operational occurrence, experienced the greatest increase of 232.1% between 2022 (28) and 2023 (93).
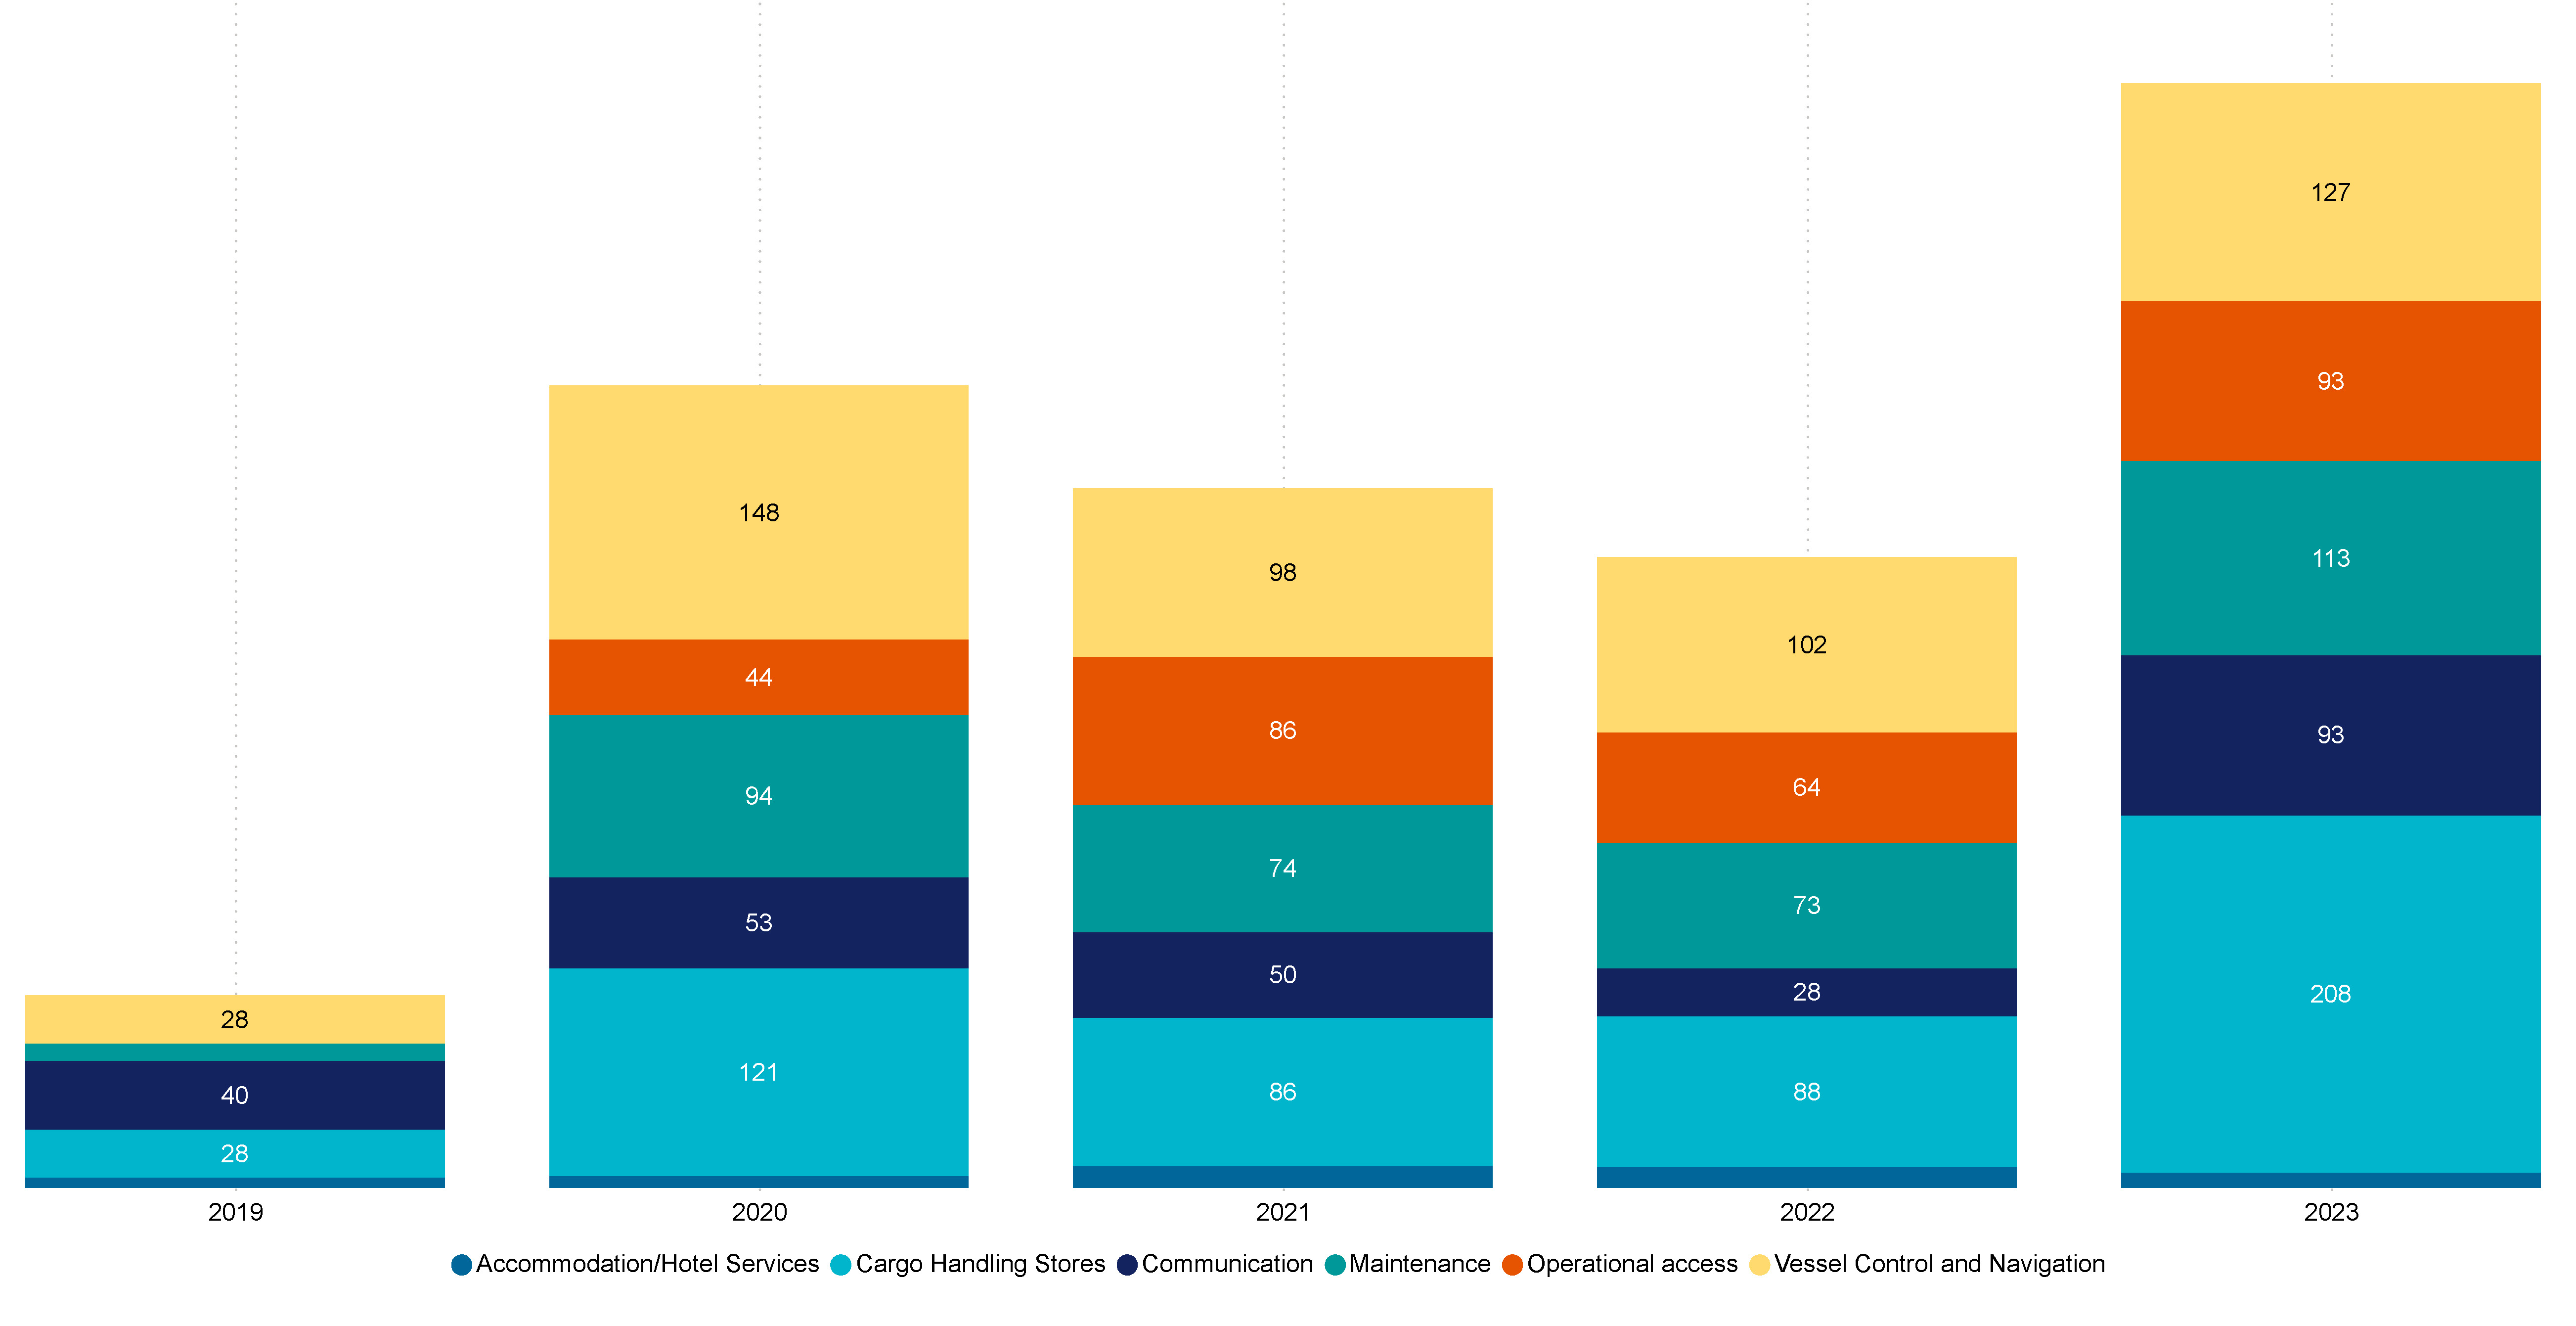
Figure 34 Top 6 operational occurrence types, FF and RAV (2019–2023)
Figure 35 shows the most frequent issues associated with operational occurrences for 2023. 31.7% (66) of the cargo handling incidents occurred during loading and unloading. 53.8% (50) of communication failures occurred during shipboard communications, 49.5% (46) of operational access incidents occurred while climbing or descending ladders and 33.9% (43) vessel control and navigation failures occurred during berthing and unberthing
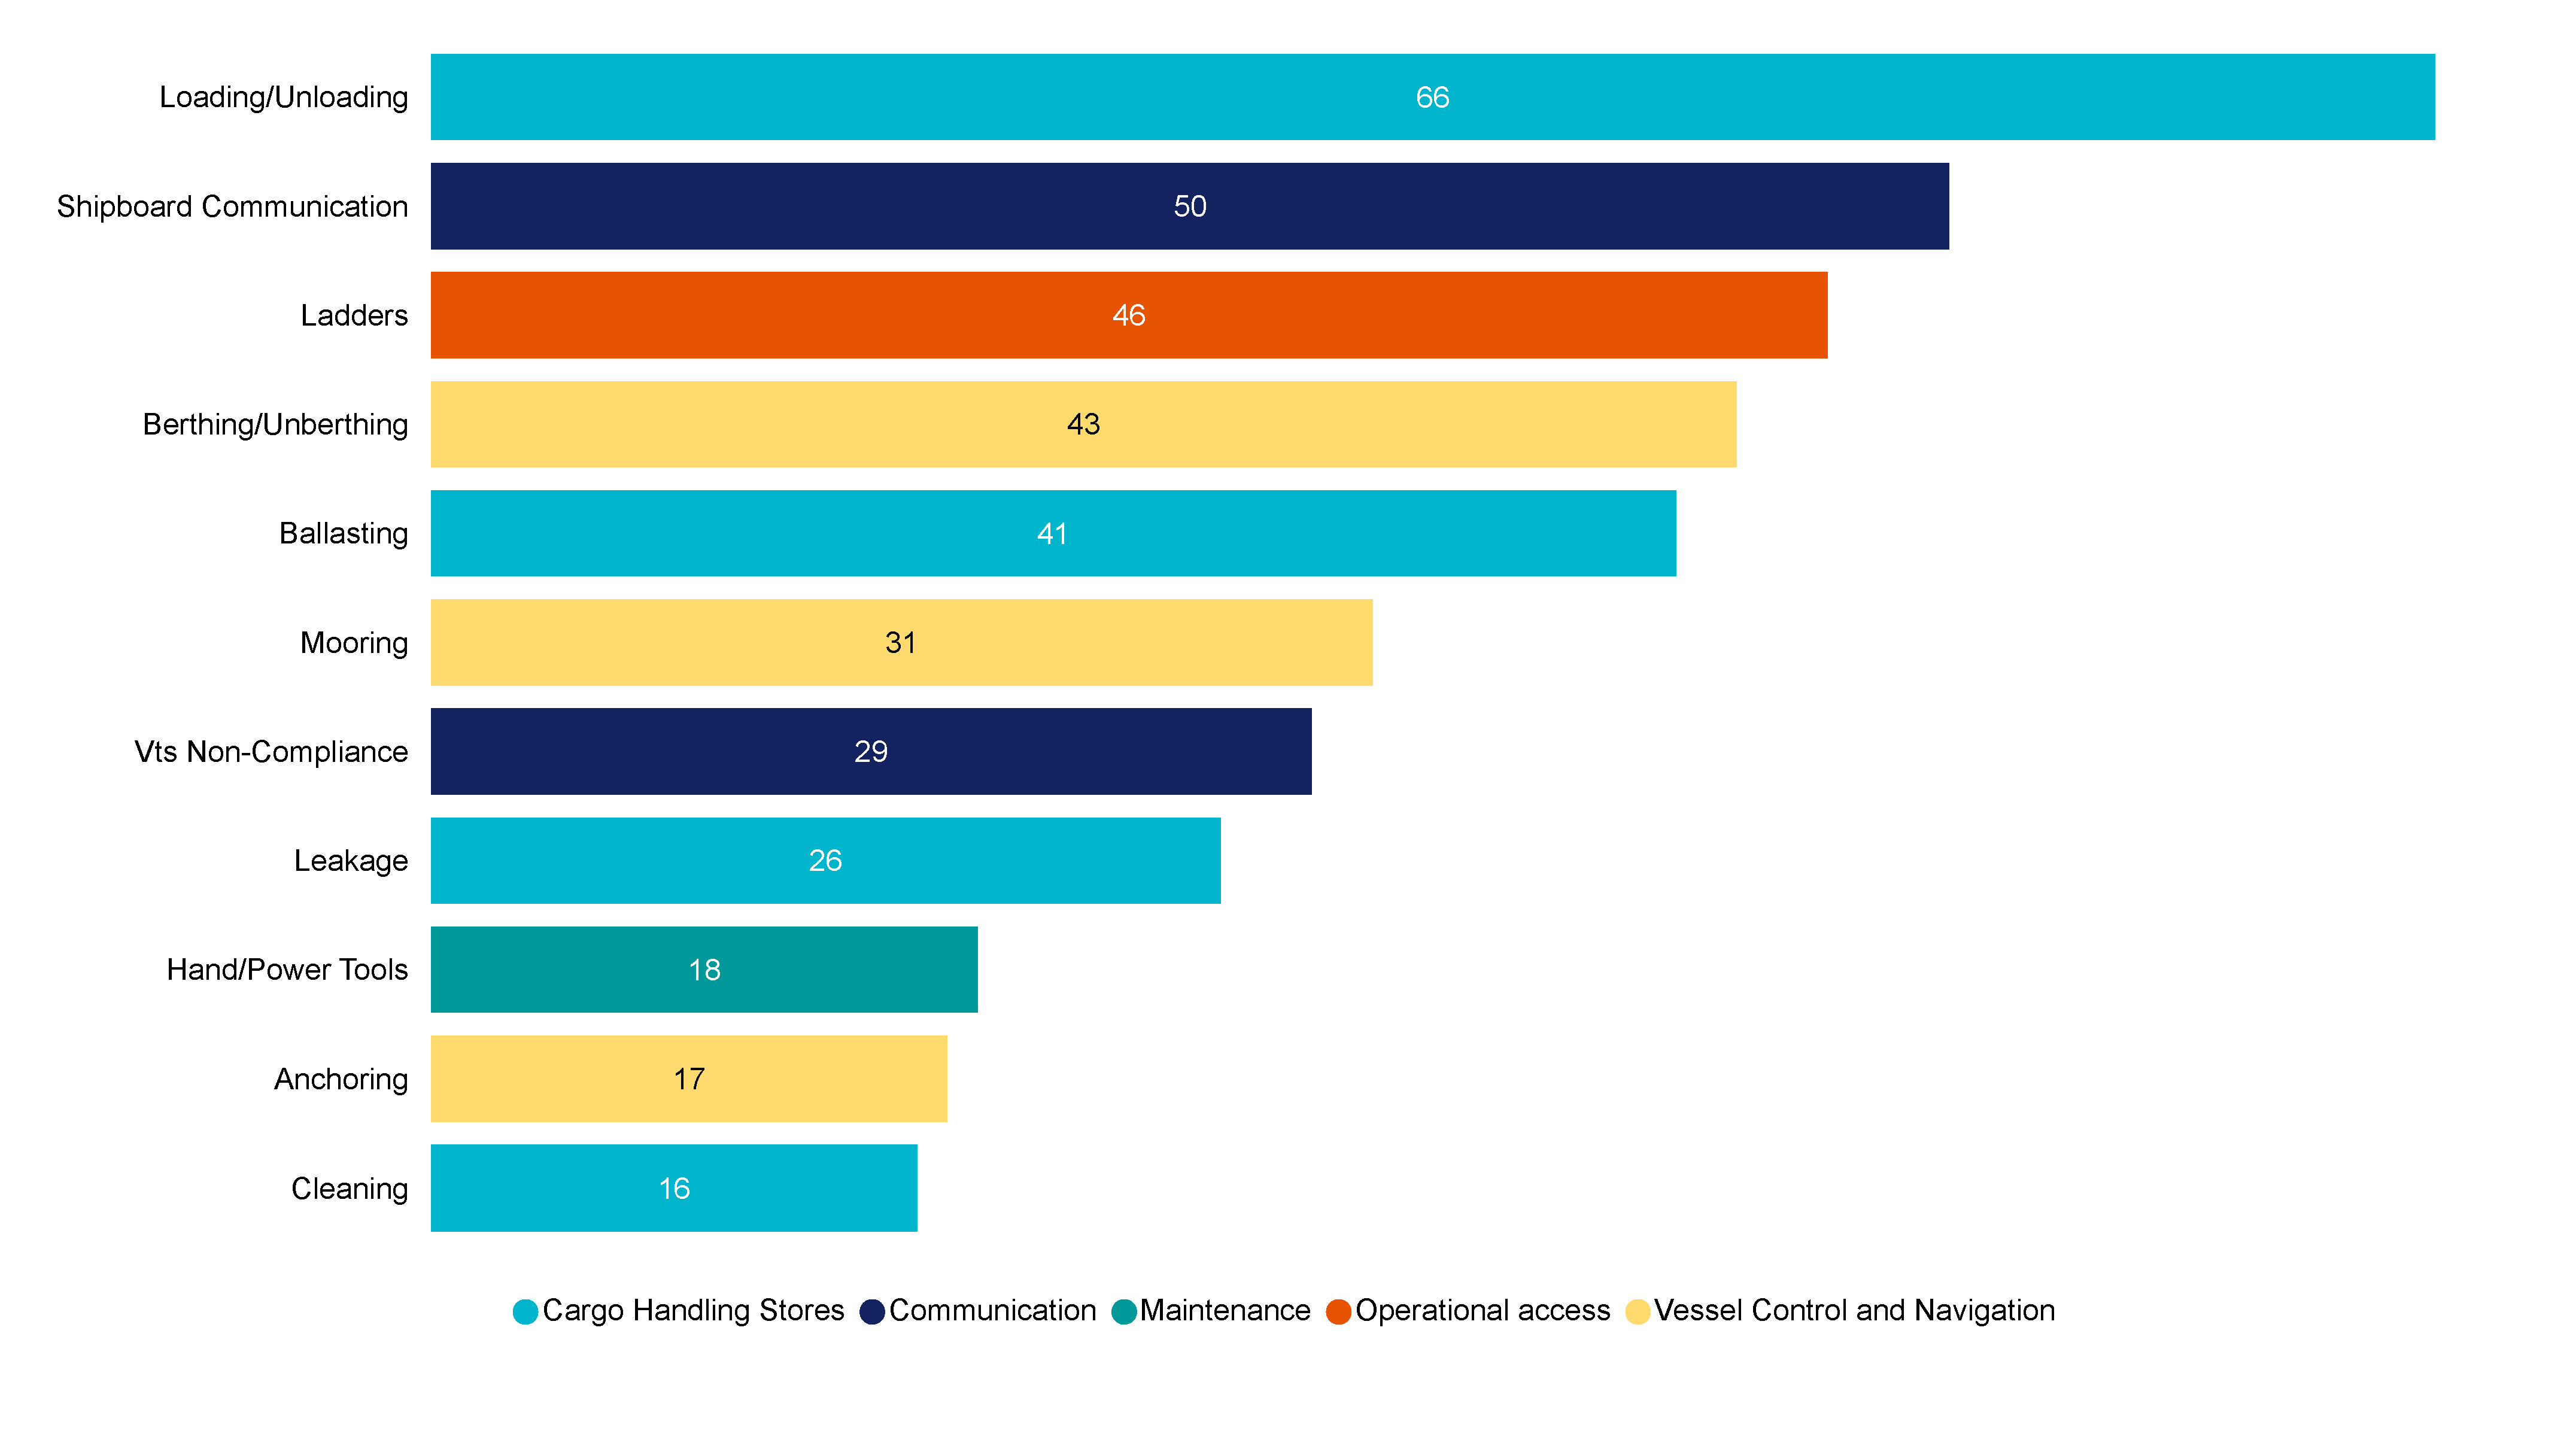
Figure 35 Top 11 issues associated with Operational occurrence types, FF and RAV (2023)
Footnotes
2 The MLC Annual 2023 report contains a detailed breakdown of seafarer fatalities on international commercial vessels in Australian waters including person overboard incidents.