Marine Incident Annual Report 2023 - Domestic Commercial vessels
Marine incident trends
AMSA received a total of 1125 marine incident reports involving 857 DCVs in 2023 which is an increase of 5.9% from 2022 (1062 reports) (Figure 2). There has been a 46.3% increase in the number of incident reports from DCVs since 2019 (767).
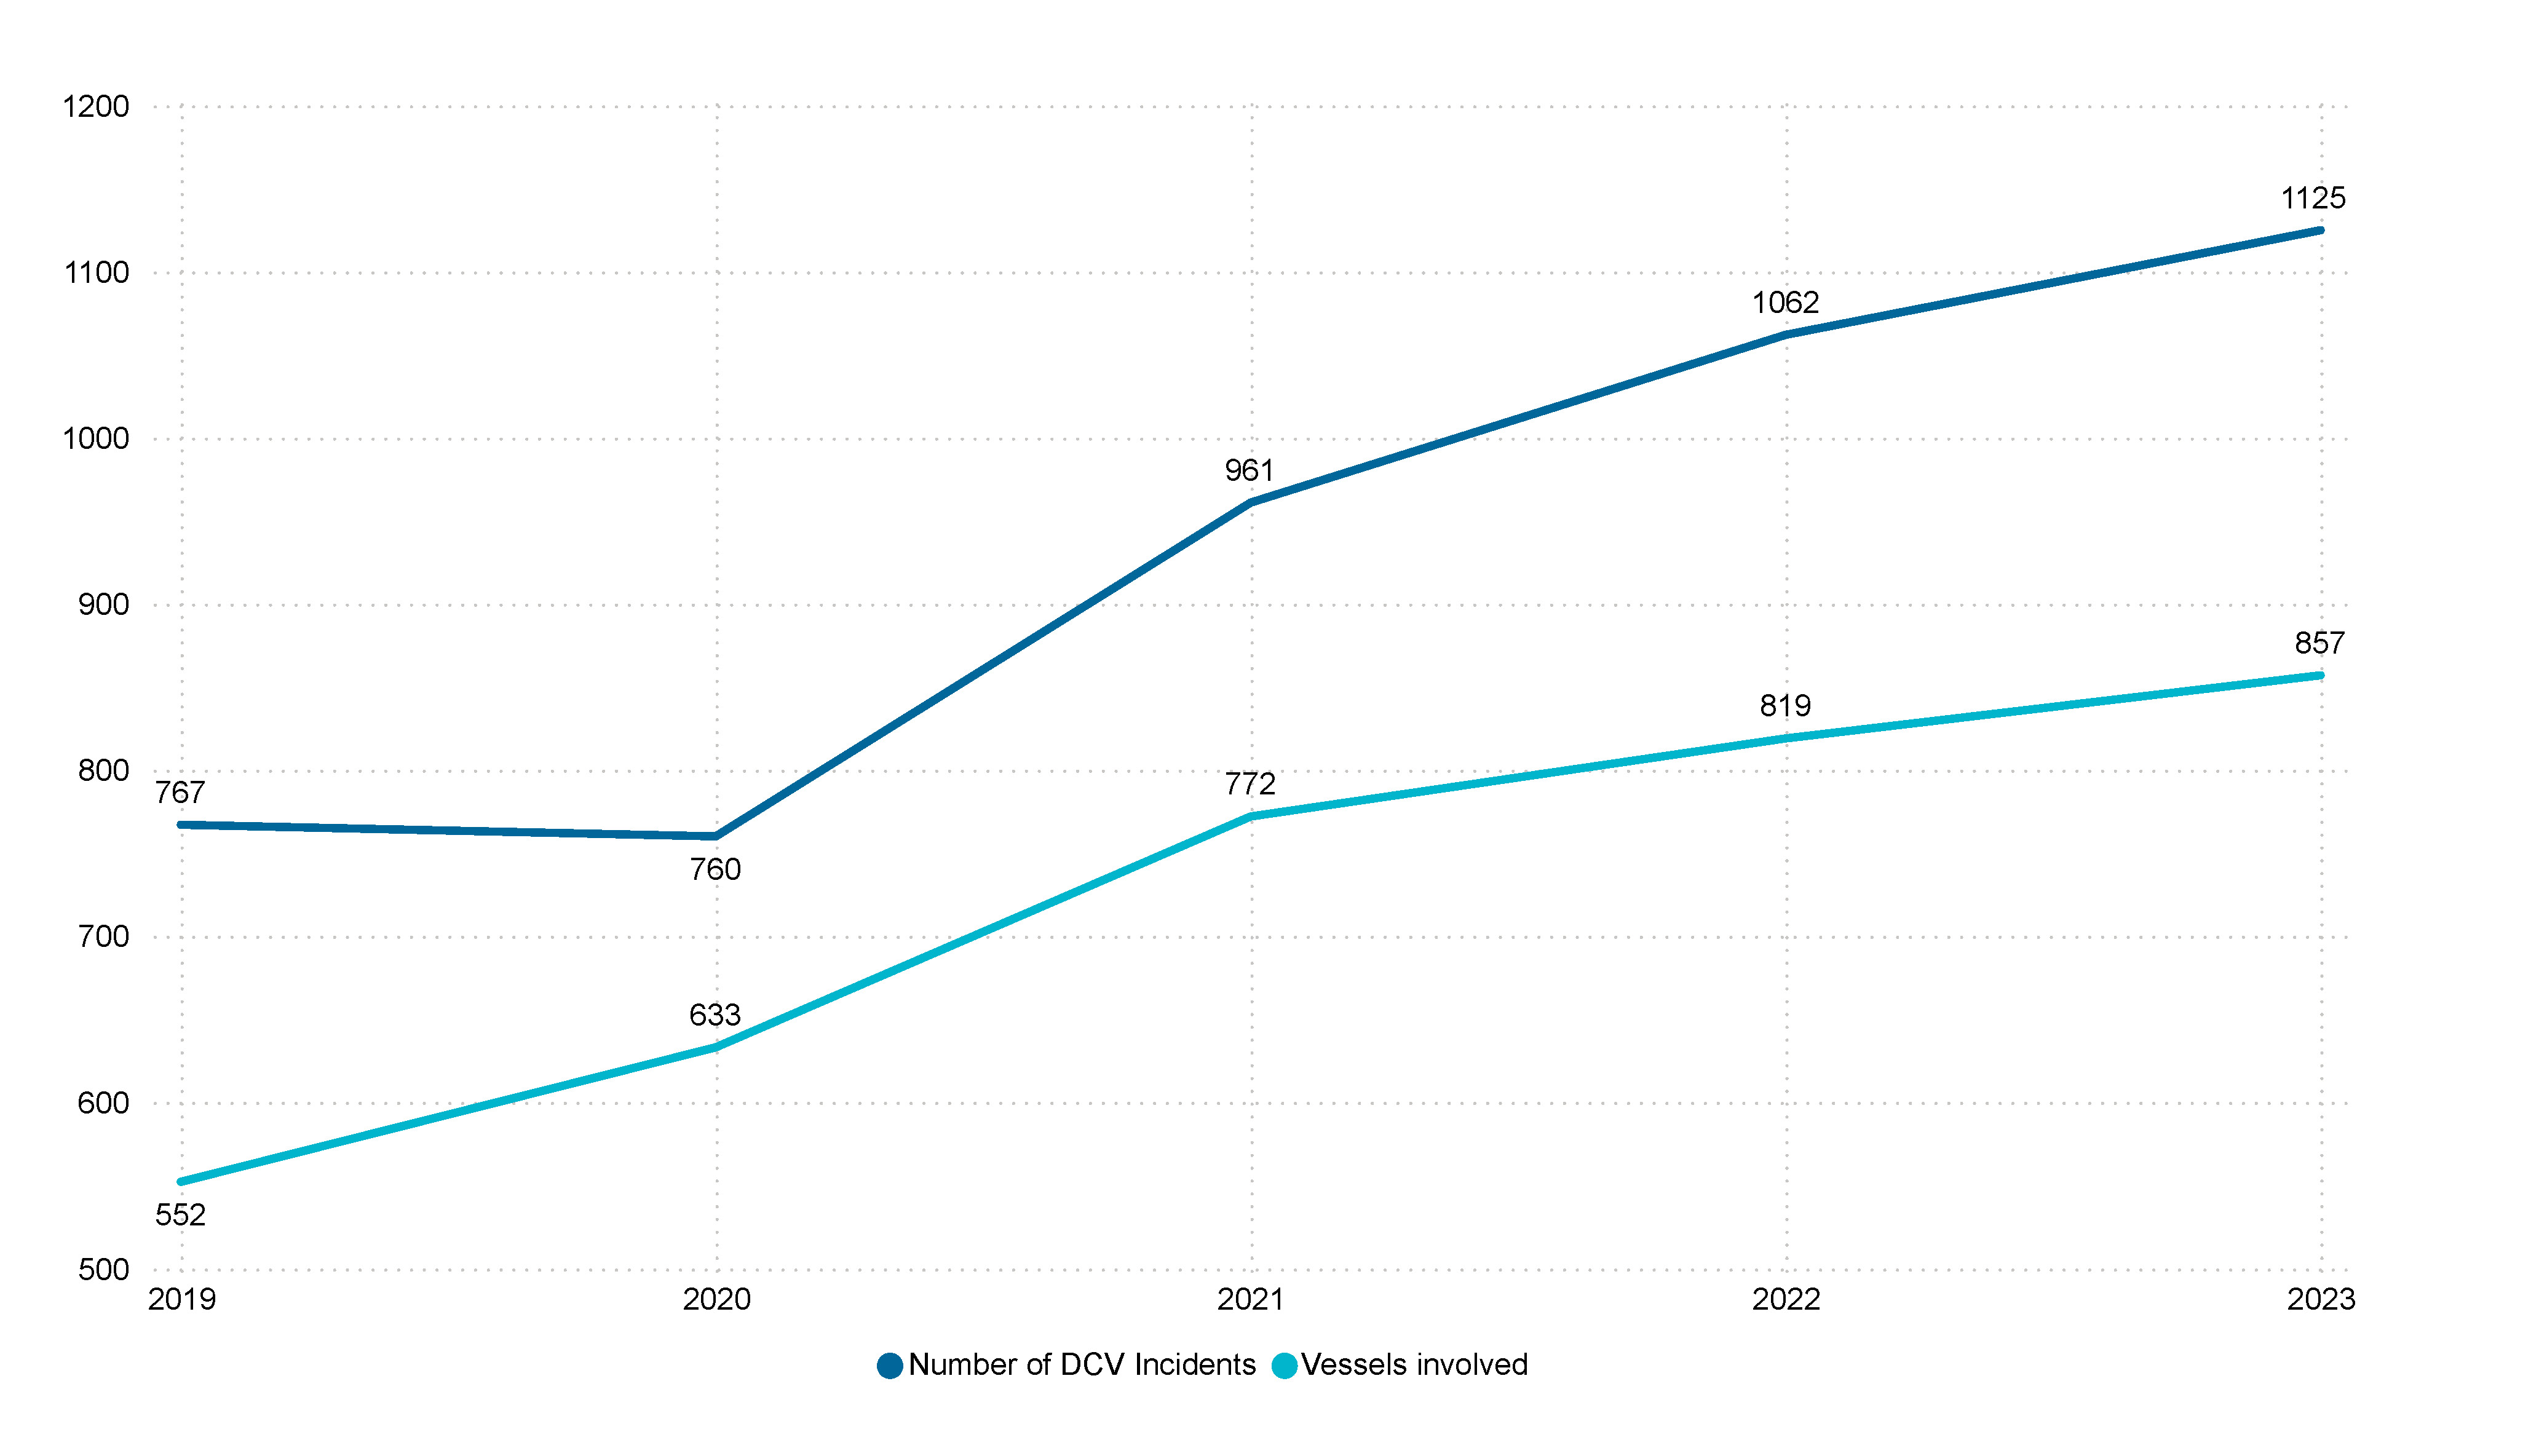
Figure 2: Trends in incident reporting – DCV’s. (2019-2023)
In 2023 (Figure 3),
- very serious incidents decreased from 8 in 2022 to 7 in 2023.
- there was an increase of 65 (25.5%) serious incidents reported from 2022.
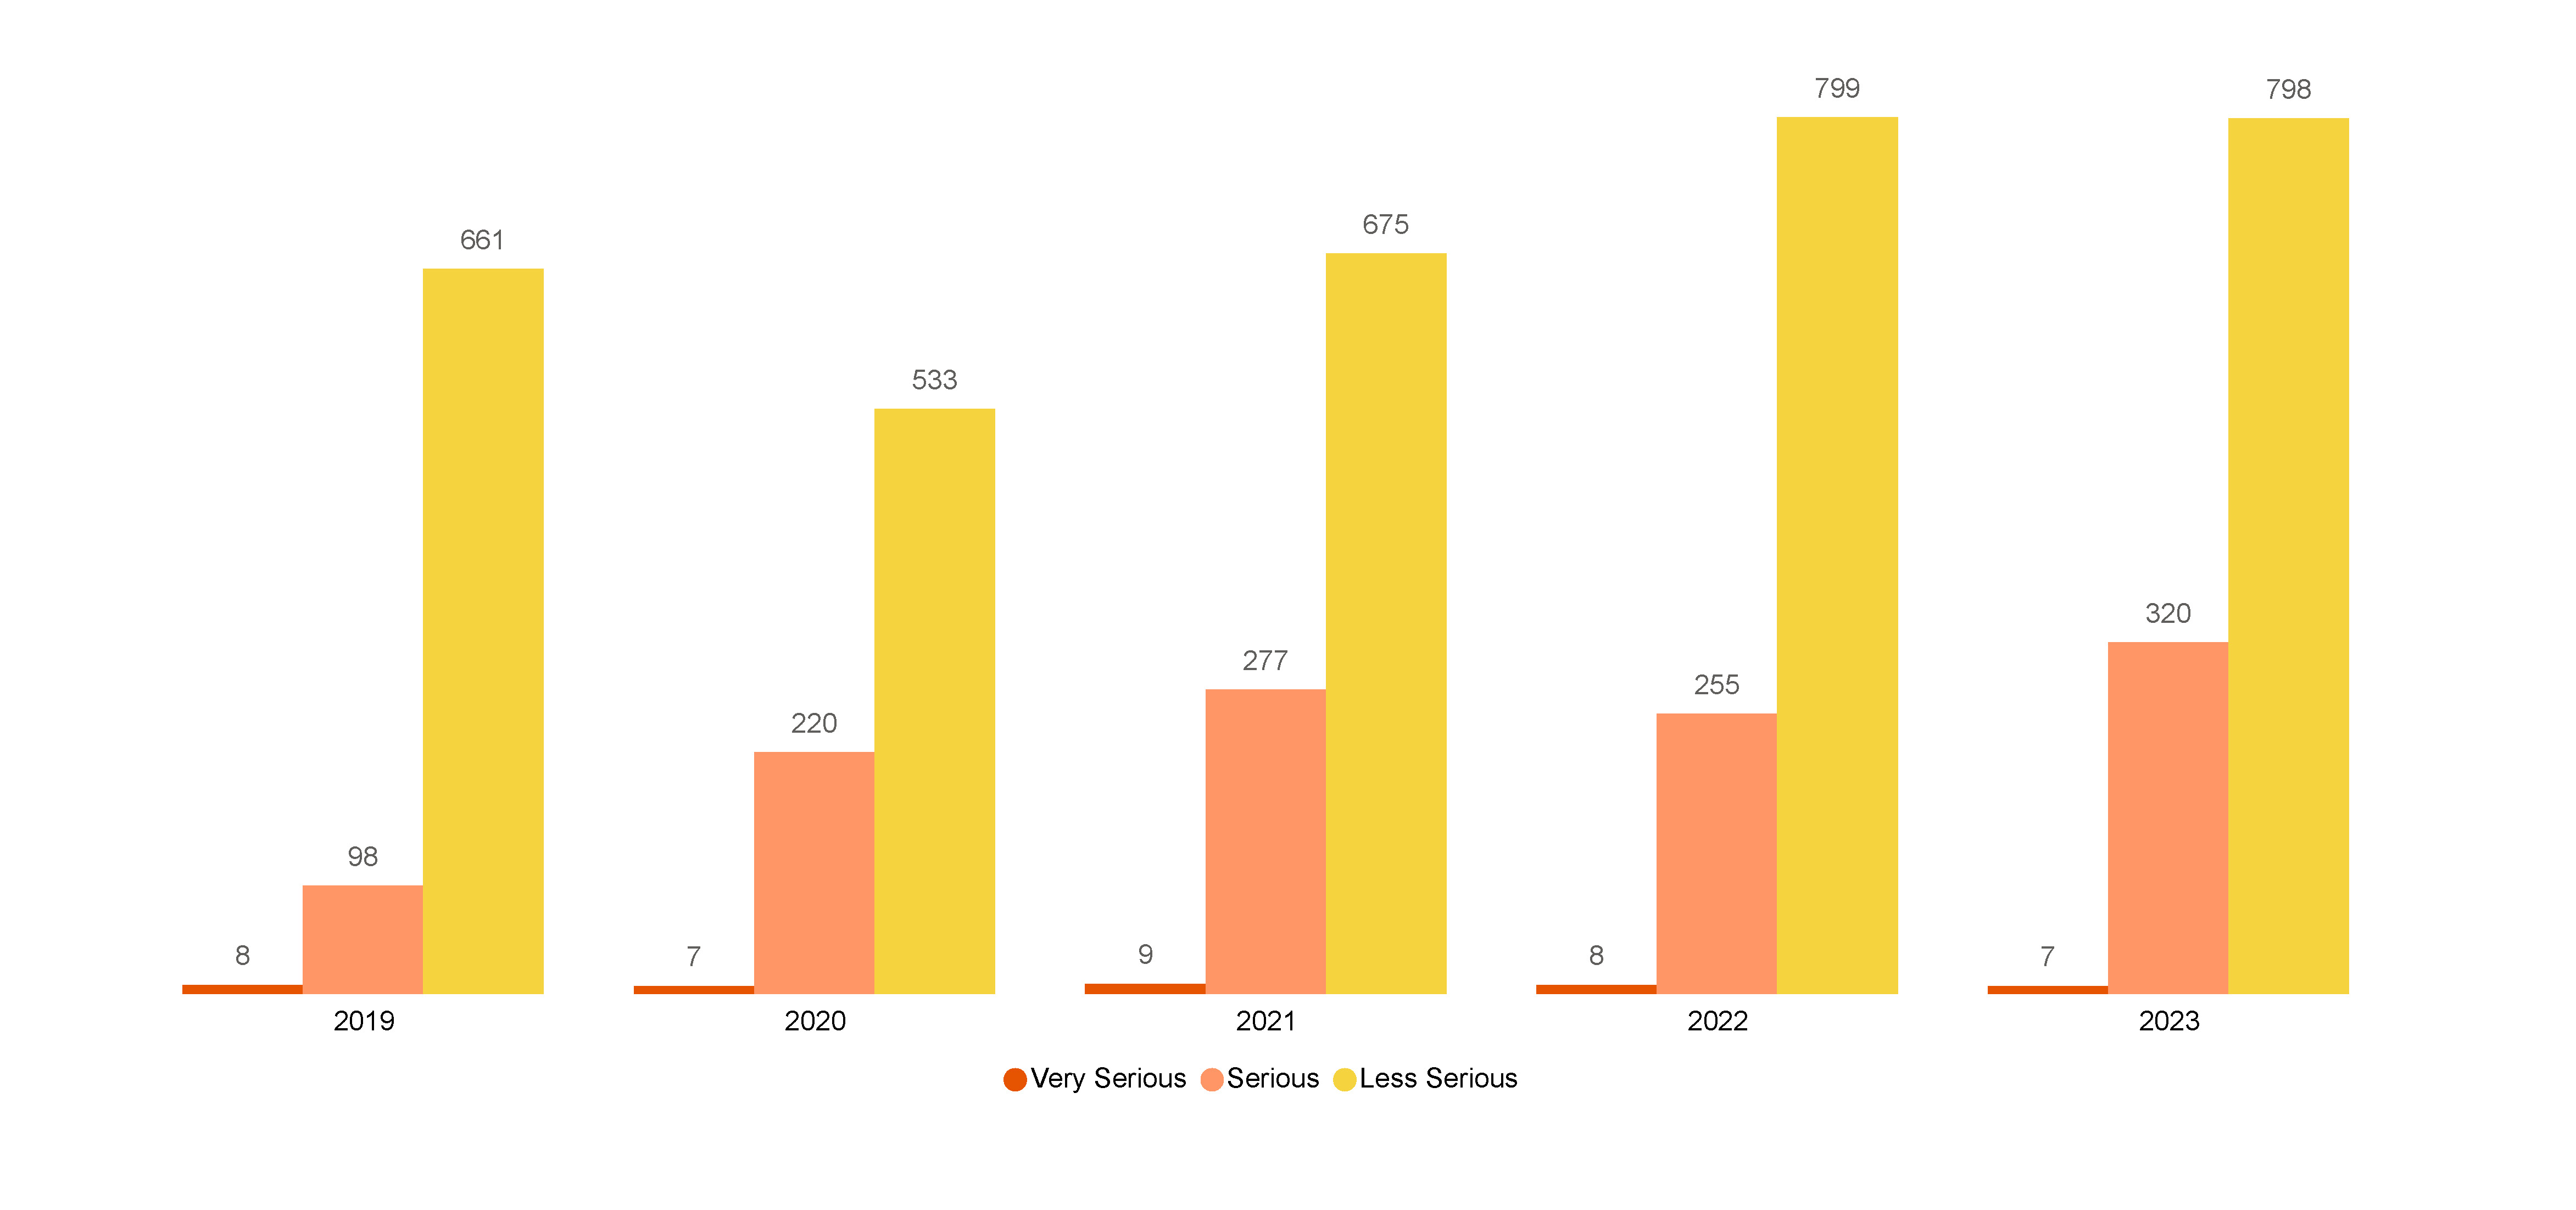
Figure 3 DCV incidents by severity (2019 - 2023)
In 2023, the DCV incidents by severity (Figure 4, Table A1) shows:
- passenger vessels continue to demonstrate a good reporting culture in relation to all other classes of vessels. Passenger vessels which account for a relatively small proportion (9.01%) of the DCV fleet reported almost half (45.2%) of all DCV incidents in 2023.
- fishing vessels and hire & drive vessels continue to be under-represented in marine incident reporting. Fishing vessels which account for 27.16% of the DCV fleet reported 11.16% of all incidents in 2023. This outcome is consistent with 2022 data where fishing vessels reported 10.8% of all incidents.
- fishing vessels reported 40.7% of serious incidents. This rate is 15.8% higher than the average rate of serious incidents reported across all vessel classes.
- hire & drive vessels which account for 13.86% of the DCV fleet reported 6.42% of all incidents in 2023.
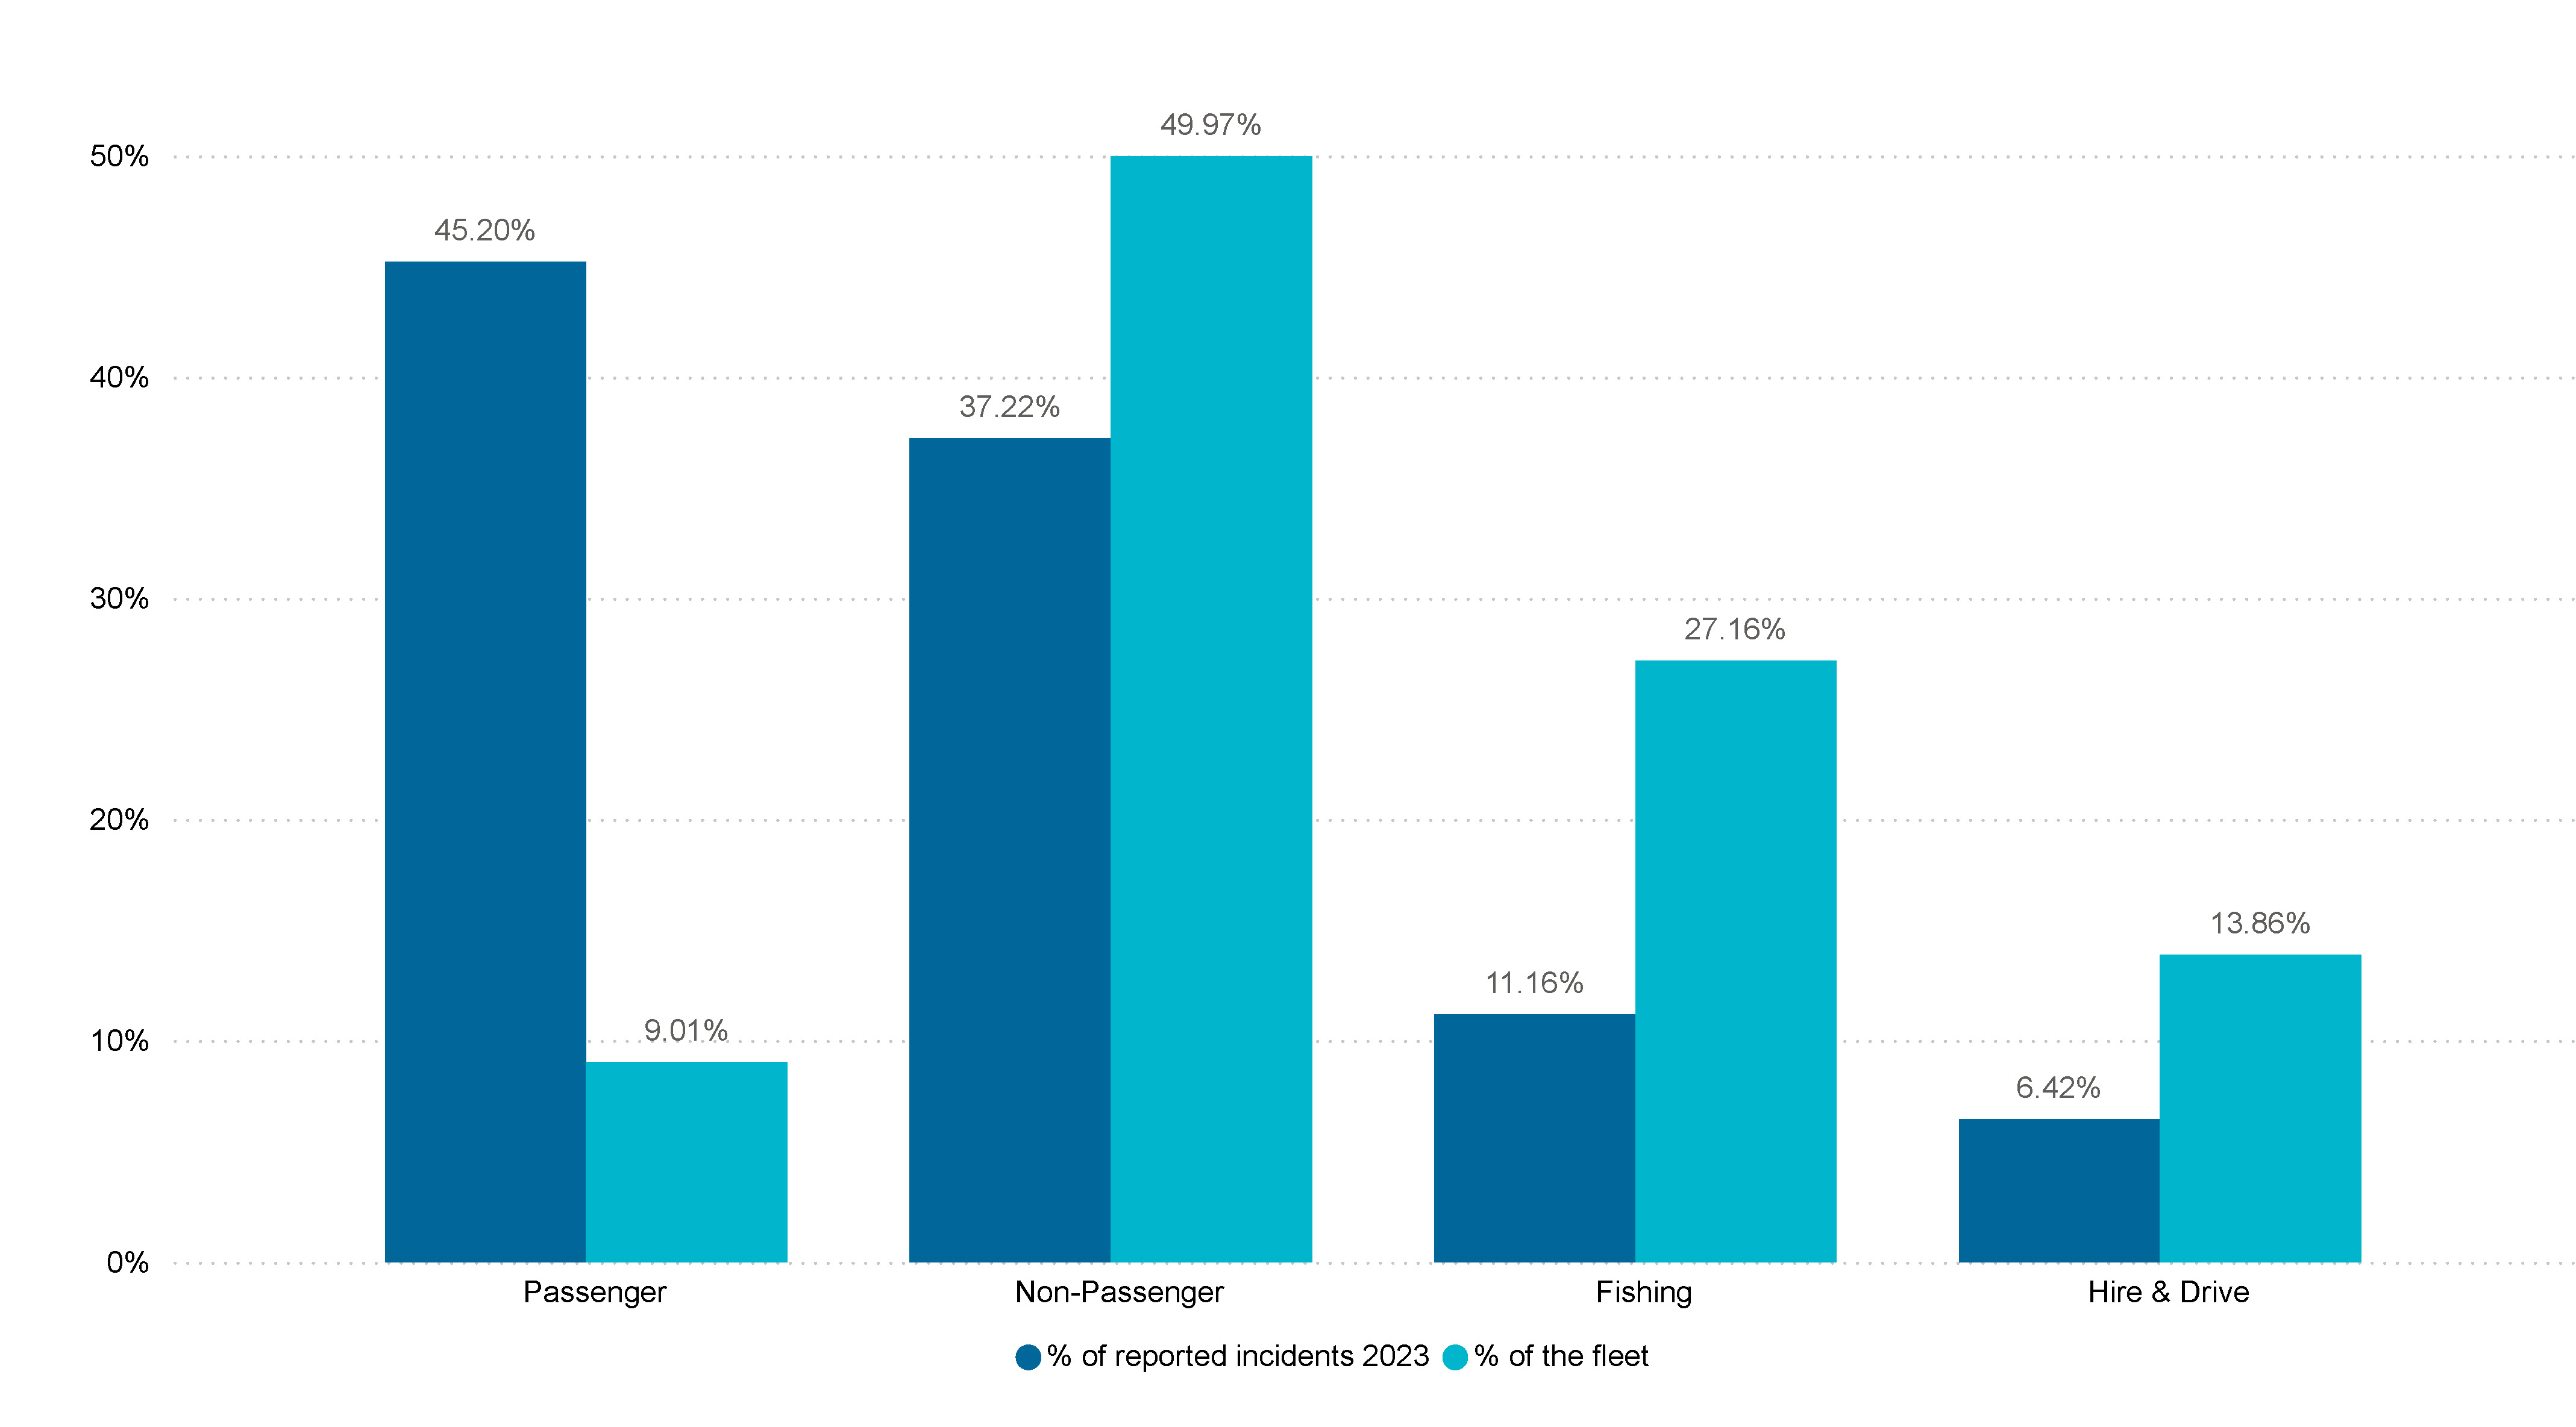
Figure 4 Percentage of DCVs that reported at least one incident by vessel class (2023 )
Figure 5 shows the percentage of DCV incident reporting by vessel length as a proportion of the DCV fleet for 2023.
Passenger vessels carry more than 12 passengers and are called Class 11.
Non-Passenger vessels carry less than 12 passengers and are not either fishing or hire and drive vessels are called Class 2.
Fishing vessels are used for fishing operations and called Class 3.
Hire and Drive vessels are used by a hirer only for recreational purposes and are called Class 4.
The largest reporting group were vessels greater than 45m in length at 29.8% of reports. This appears to be consistent with the reporting rate of passenger vessels (Figure 4), since large passenger vessels report more incidents proportional to the percentage of vessels in the fleet (4.62%).
Smaller vessels, such as those under 12m in length, make up only 4.7% of reported incidents, despite representing 35.3% of the DCV fleet.
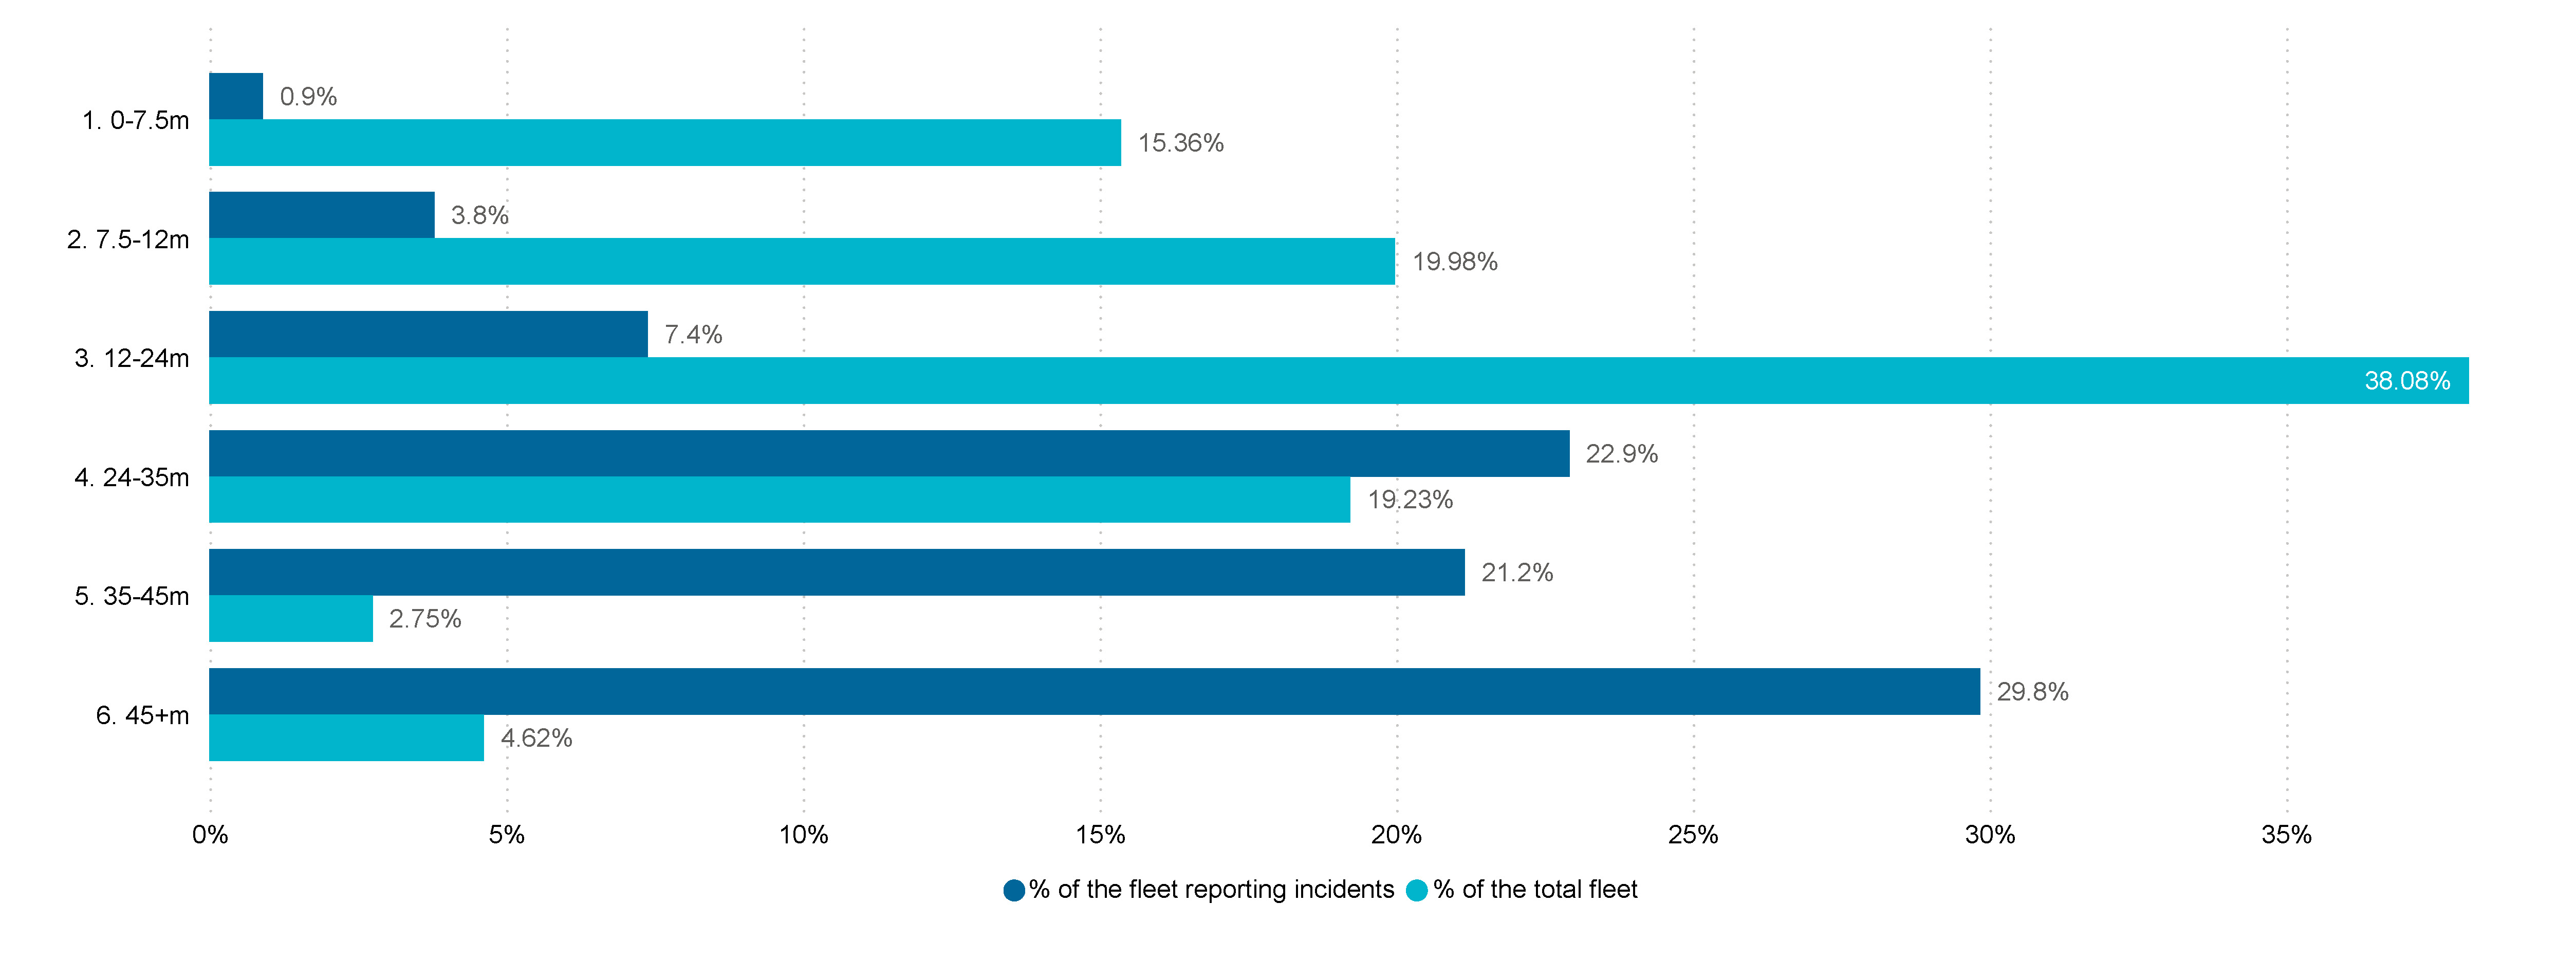
Figure 5 Percentage of DCVs incidents reported by vessel length and as a percentage of the DCV fleet (2023)
Consequences to people
Fatalities
In 2023 there were three operational-related fatalities associated with DCV vessel operations.
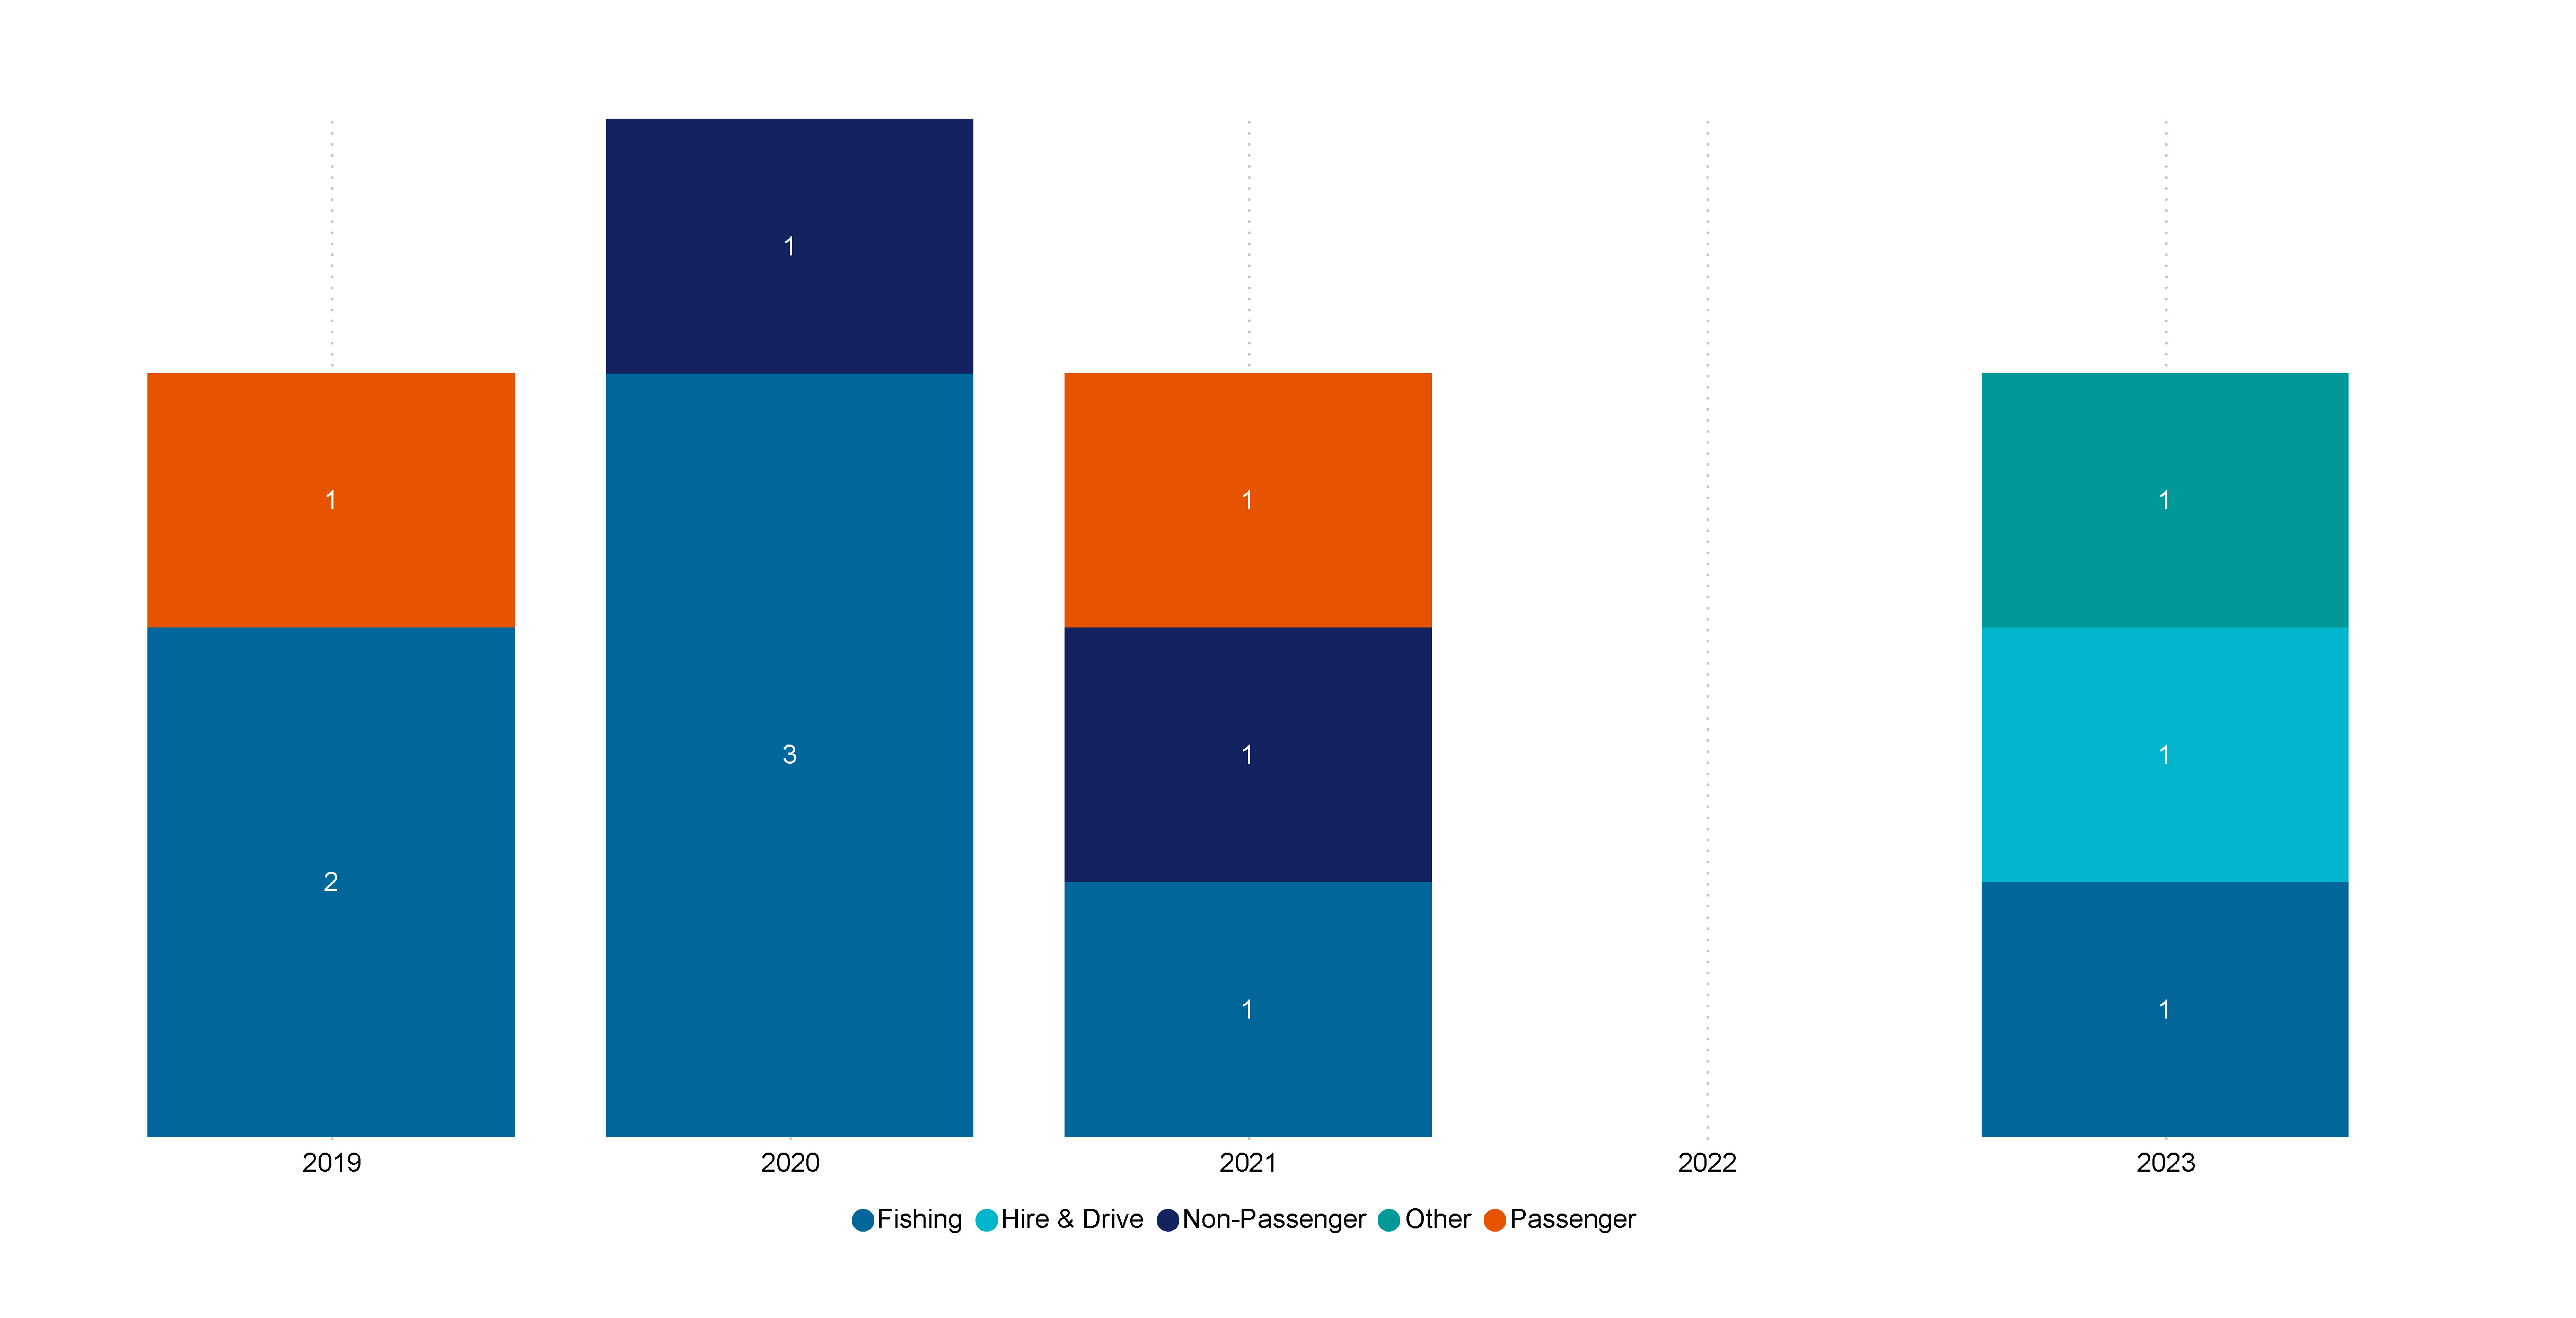
Figure 6: Fatalities by year and vessel class (2019-2023)
Between 2019 and 2023, there were 13 operational-related fatalities on DCVs (9 crew and 2 passengers). Seven (63.6%) of these occurred on fishing vessels (Figure 6). Most fatalities between 2019 and 2023 occurred in Queensland (Figure 7).
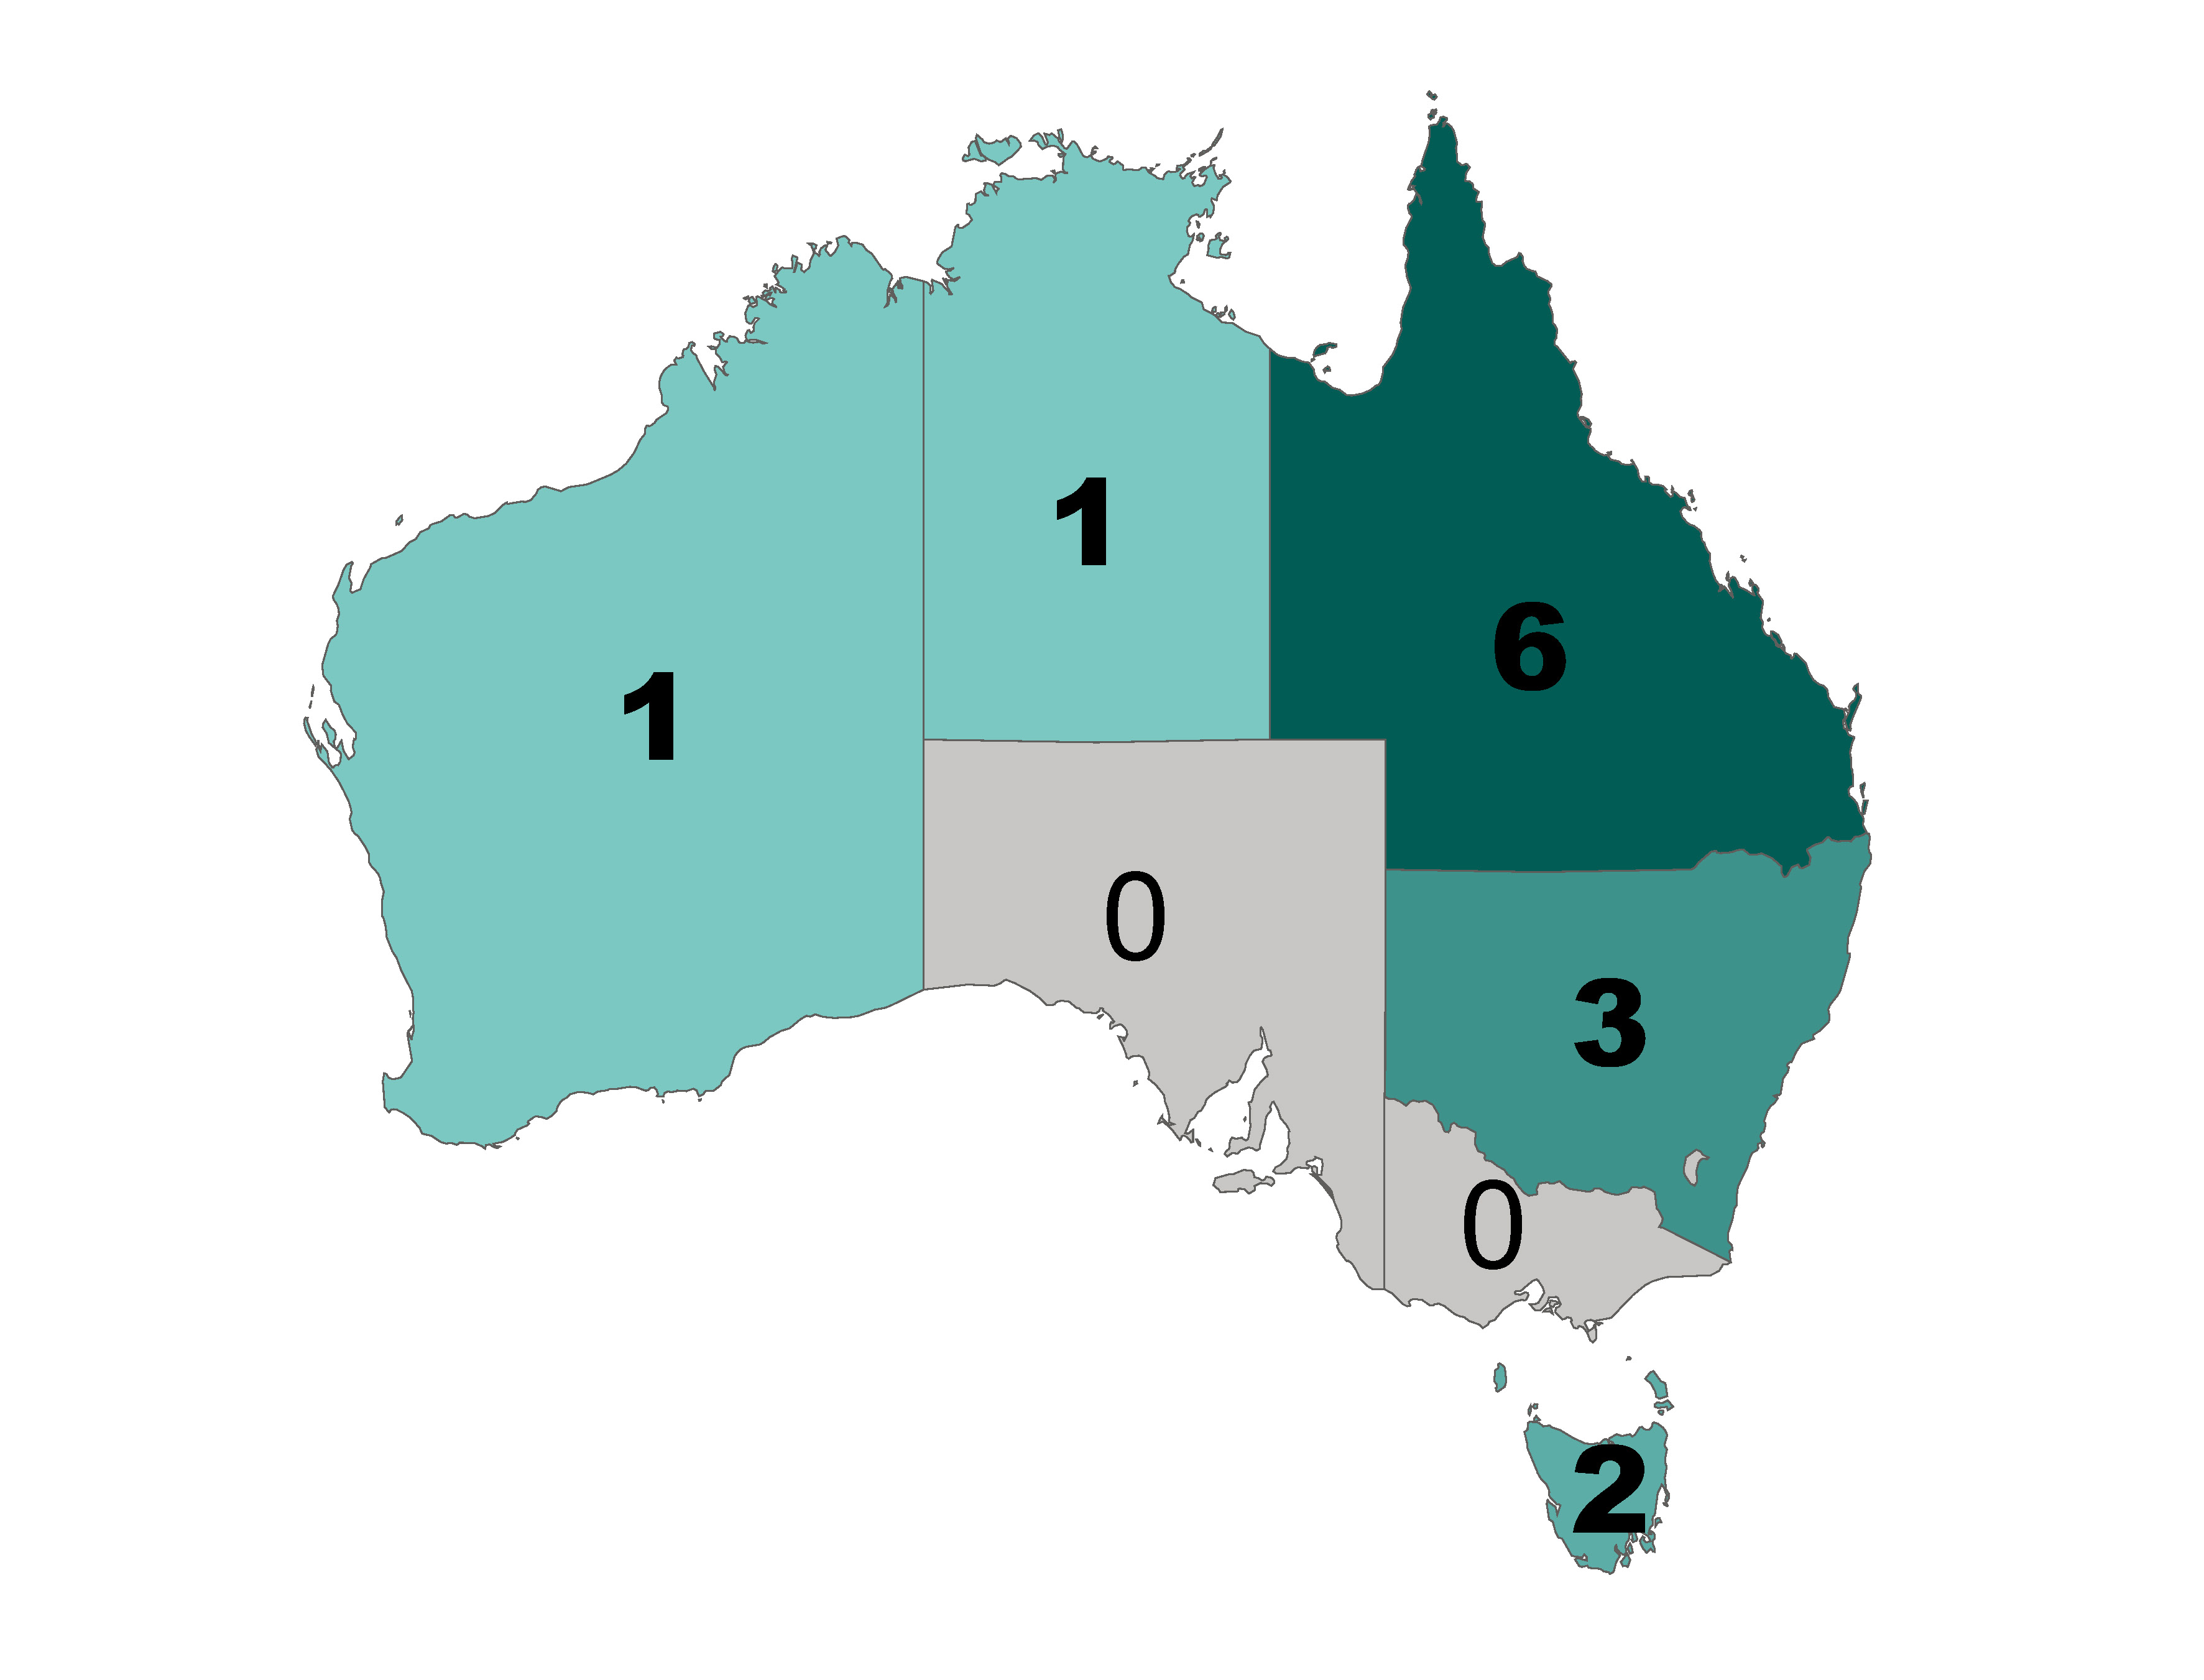
Figure 7 Number of fatalities by State (2019-2023)
In 2023, the fatality rate (the number of fatalities per 100,000 crew employed on DCVs) was 1.5. This remains lower than the five-year average annual fatality rate of 3.0 per 100,000 crew2 and lower than the fatality rate for Agriculture, forestry & fishing and Transport postal & warehousing reported in 2022 (Table 1).
Table 1 Fatality rate per 100,000 crew employed on DCVs compared to similar industries5
| Year of incident | Number of operational-related crew fatalities on DCV fatalities | Domestic commercial vessels fatality rate per 100,000 crew3 | Agriculture, forestry & fishing fatality rate per 100,000 workers | Transport, postal & warehousing fatality rate per 100,000 workers |
|---|---|---|---|---|
| 2019 | 2 | 3 | 9.4 | 9 |
| 2020 | 4 | 6.1 | 13.1 | 7.8 |
| 2021 | 2 | 3 | 10.4 | 7.9 |
| 2022 | 0 | 0 | 14.7 | 9.5 |
| 2023 | 1 | 1.5 | No data available yet4 | No data available yet |
| Five-year average (2018-2022) | 1.8 | 2.7 | 12.1 | 7.8 |
| Five-year average (2019-2023) | 1.8 | 3 |
Injuries
In 2023, 19.4% of incident reports on DCVs included an injury to a crew member or passenger (Table 2). Of these, 37.4% resulted in at least one serious injury6 to a person (Figure 8).
Table 2 Reported injuries to a crew member or passenger as a proportion of all reported incidents (2020-2023)
| Year | 2020 | 2021 | 2022 | 2023 | ||||
|---|---|---|---|---|---|---|---|---|
| Consequence | Total | %DCV Incidents | Total | %DCV Incidents | Total | %DCV Incidents | Total | %DCV Incidents |
| Crew Injury | 78 | 10.3% | 109 | 10.6% | 113 | 10.6% | 104 | 9.2% |
| Passenger Inury | 52 | 7.0% | 72 | 7.9% | 84 | 7.9% | 115 | 10.2% |
| Total | 130 | 17.3% | 180 | 18.5% | 194 | 18.5% | 2 | 19.4% |
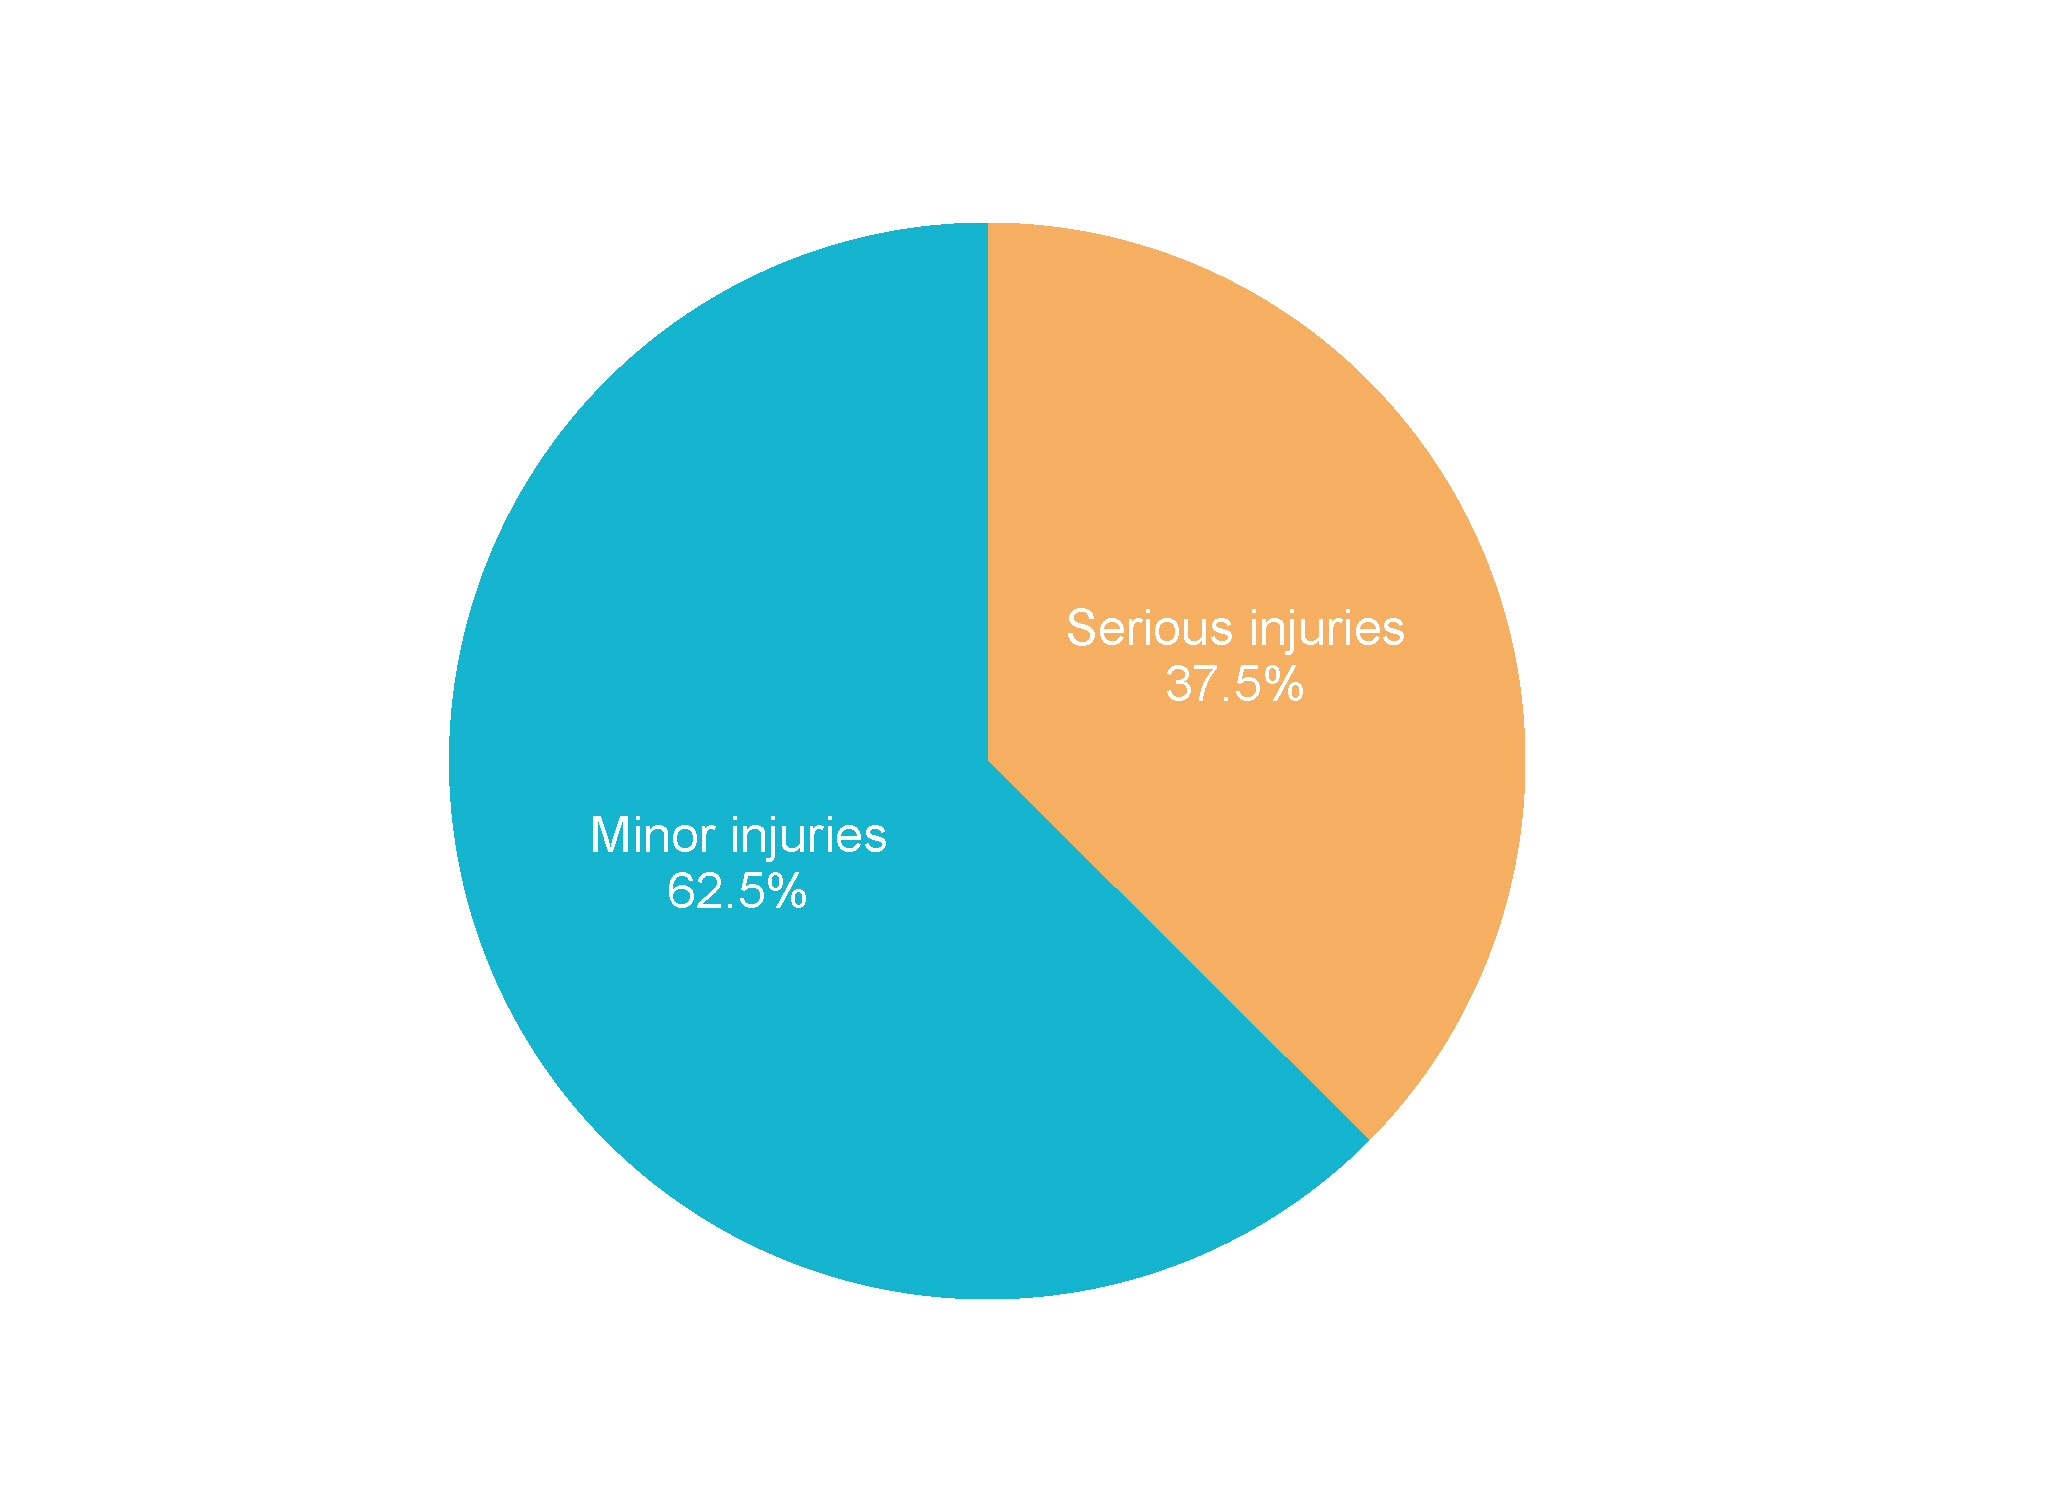
Figure 8 Injuries by severity (2023)0
The total number of serious injuries reported to AMSA increased from 5.6% in 2022 to 8.3% in 2023 (Figure 9). In 2023, 44.8% of serious injury incidents were reported by passenger operations, 36.1% were reported by non-passenger operations, 7.3% were reported by hire and drive operations, and 10.8% were reported by fishing operations.
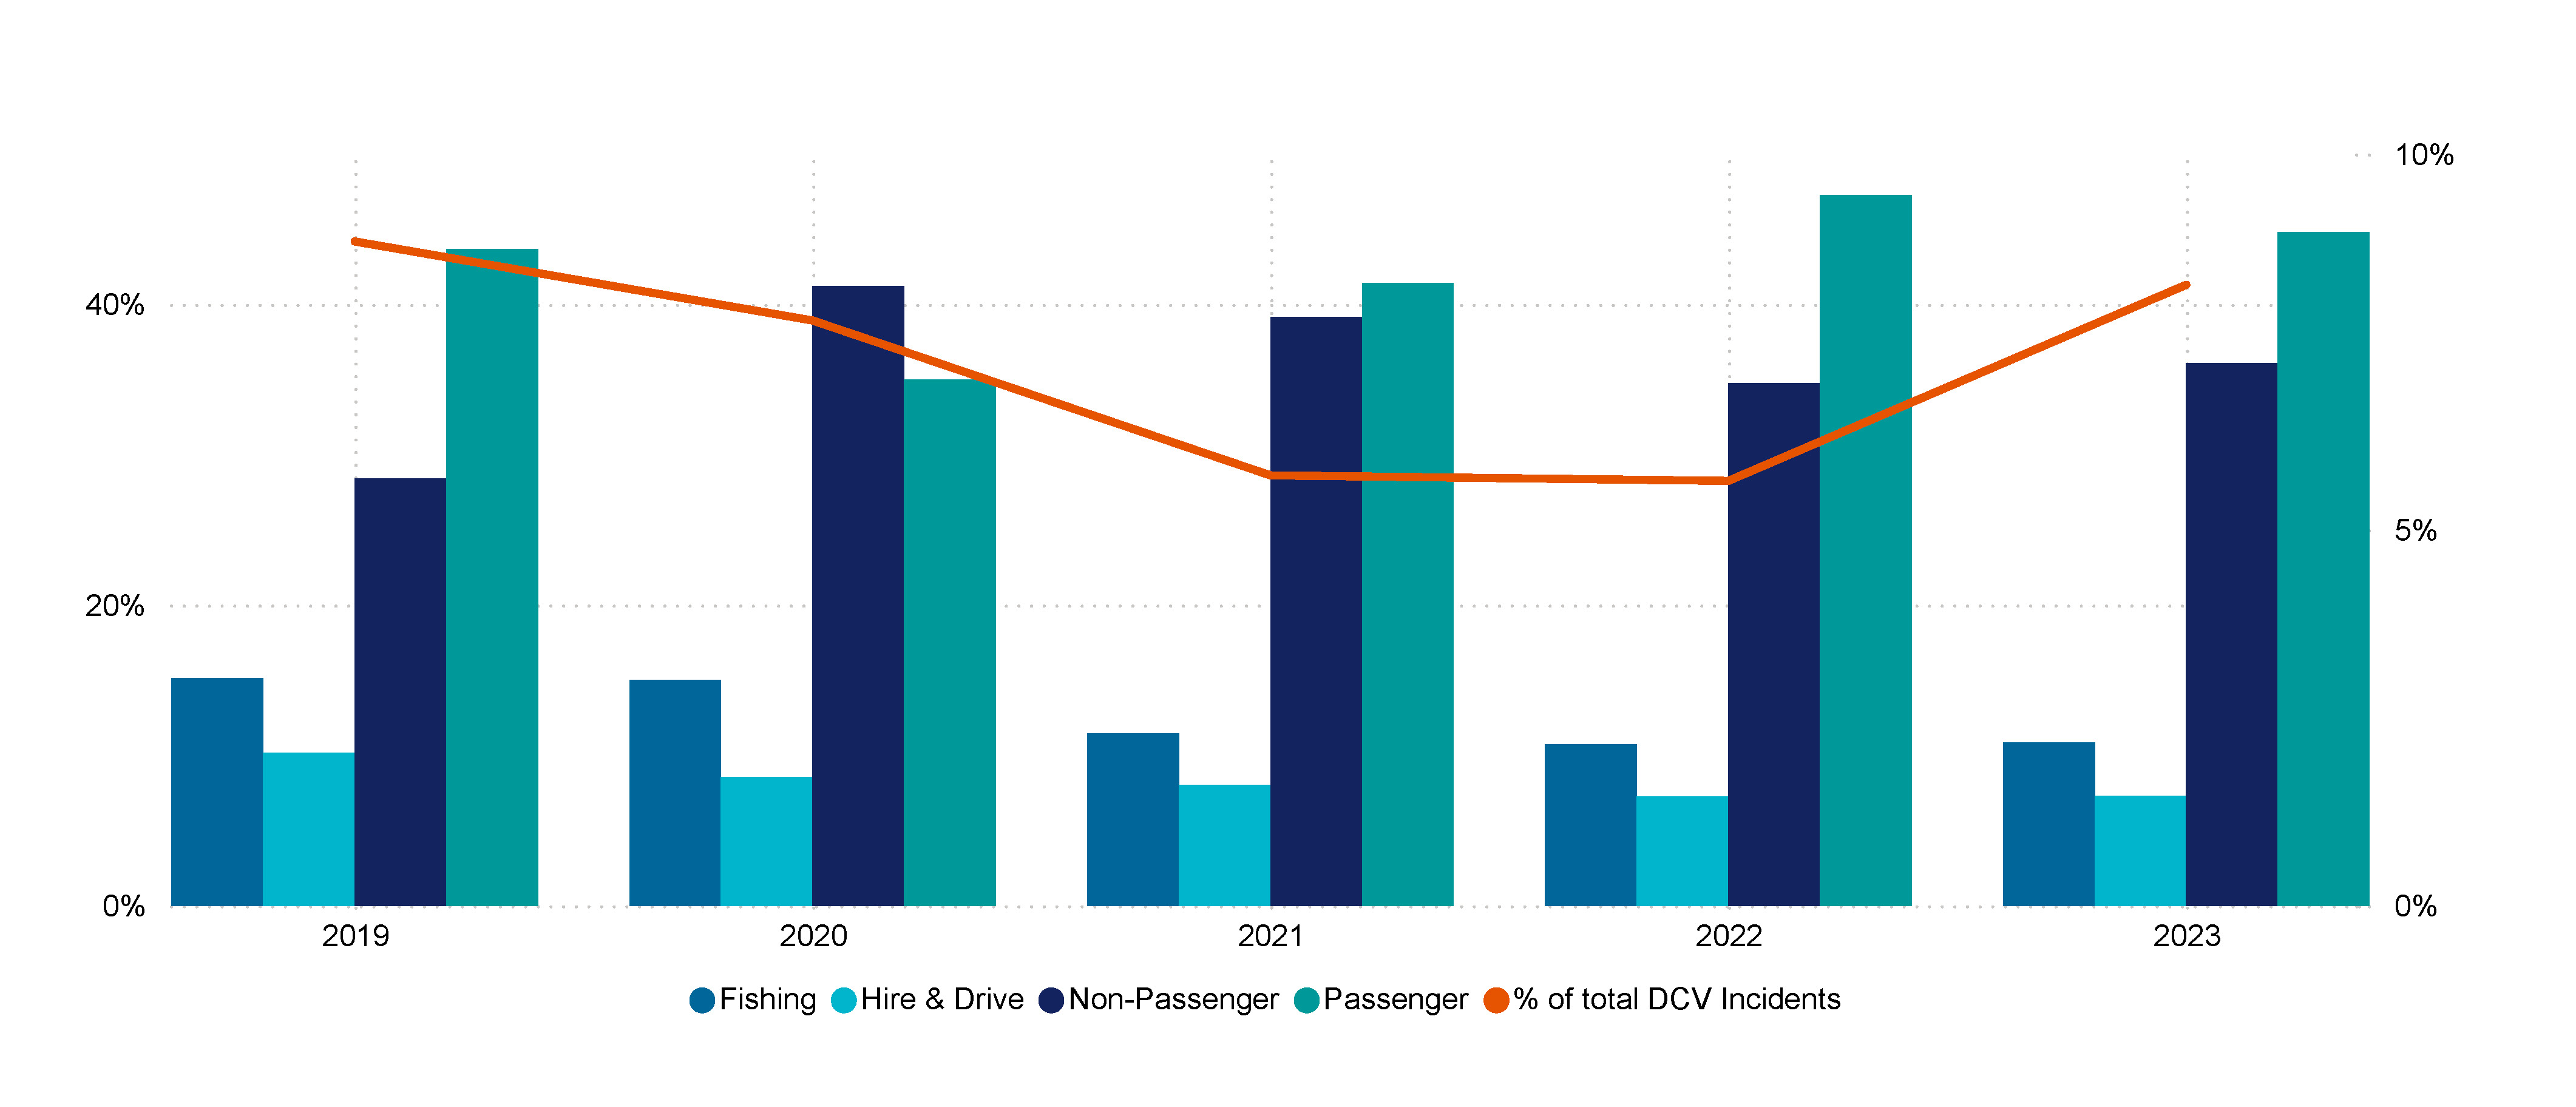
Figure 9 Percentage of DCV incidents involving serious injuries by vessel class (2019-2023)
In 2023, most crew injuries were associated with the control and navigation of the vessel (26 incidents) followed by weather and water conditions (22 incidents) and operational access (19%). (Figure 10).
For 2023, passenger injuries were associated with weather and water conditions (23 incidents), operational access (20 incidents) and vessel control and navigation (18 incidents) (Figure 10).
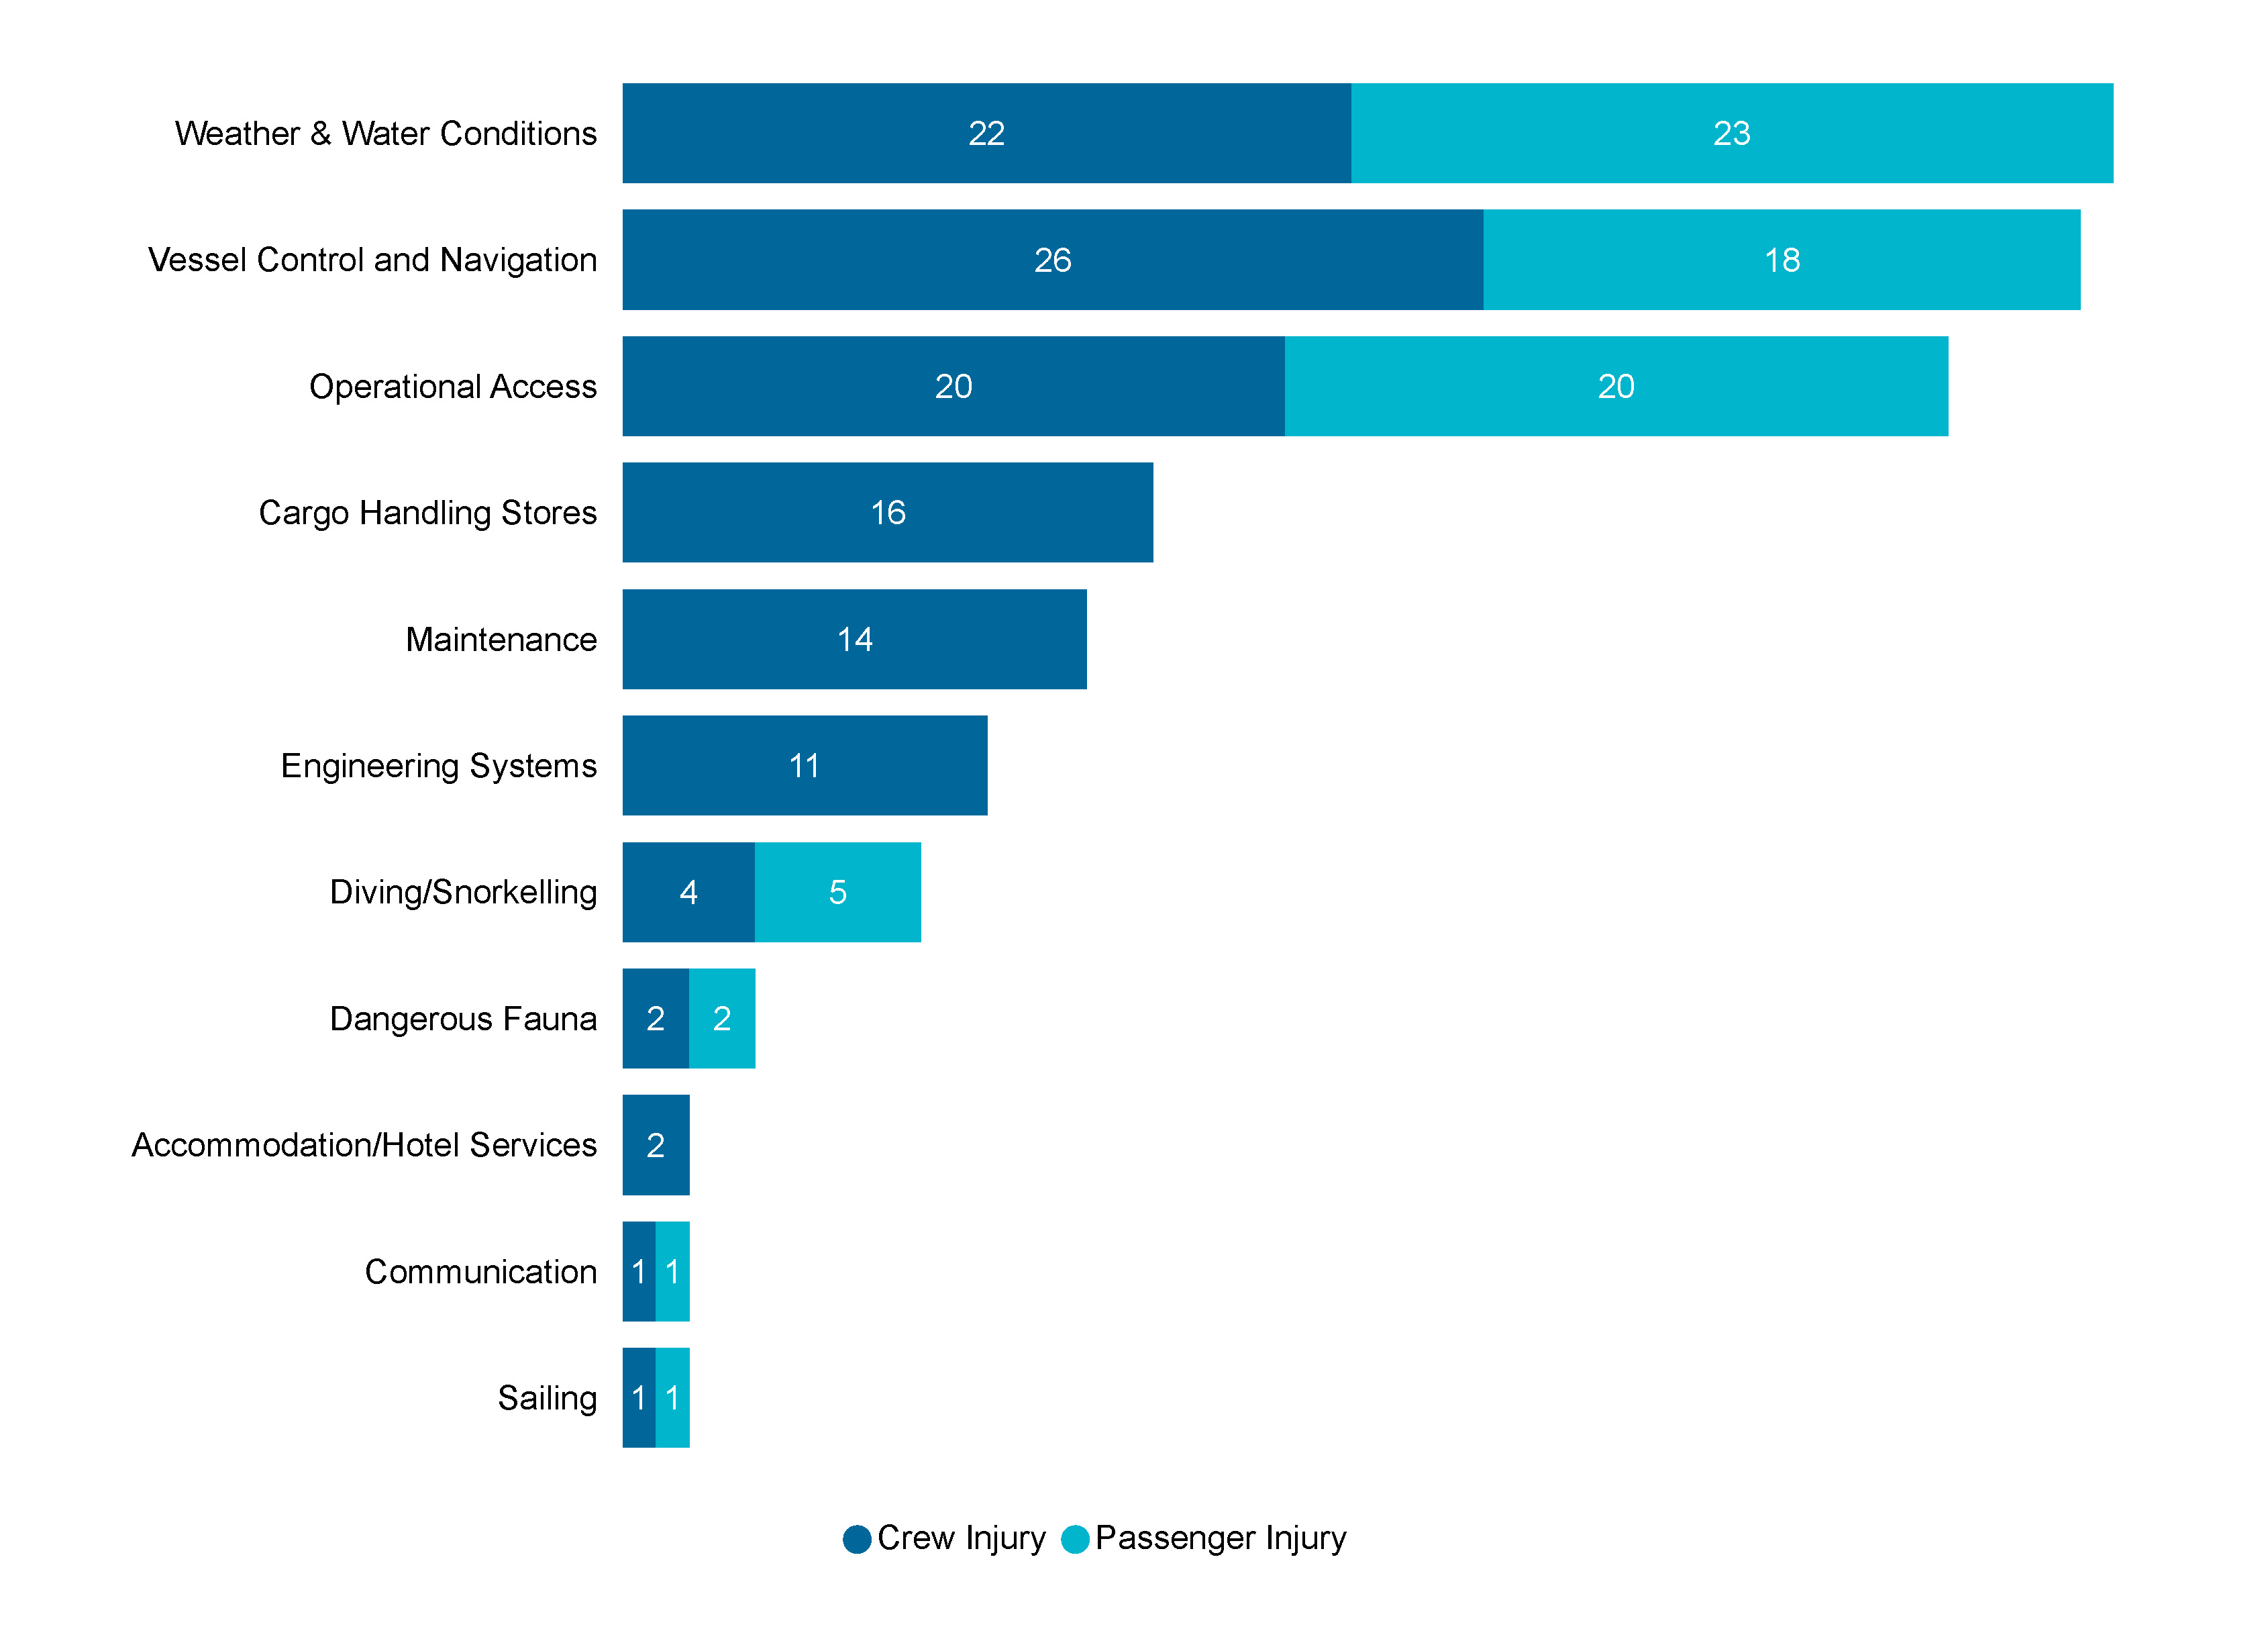
Figure 10 Activity associated with injury for crew and passenger, all vessel classes (2023)
Figure 11 shows the person overboard incidents for DCVs for 2023, by vessel class for 2023 and showing life jacket status. Out of the 79 incident reports:
- 37 incidents with person/s overboard wearing a life jacket.
- 28 persons overboard not wearing a life jacket and 14 where unknown if wearing a life jacket.
- 46 involved crew members overboard
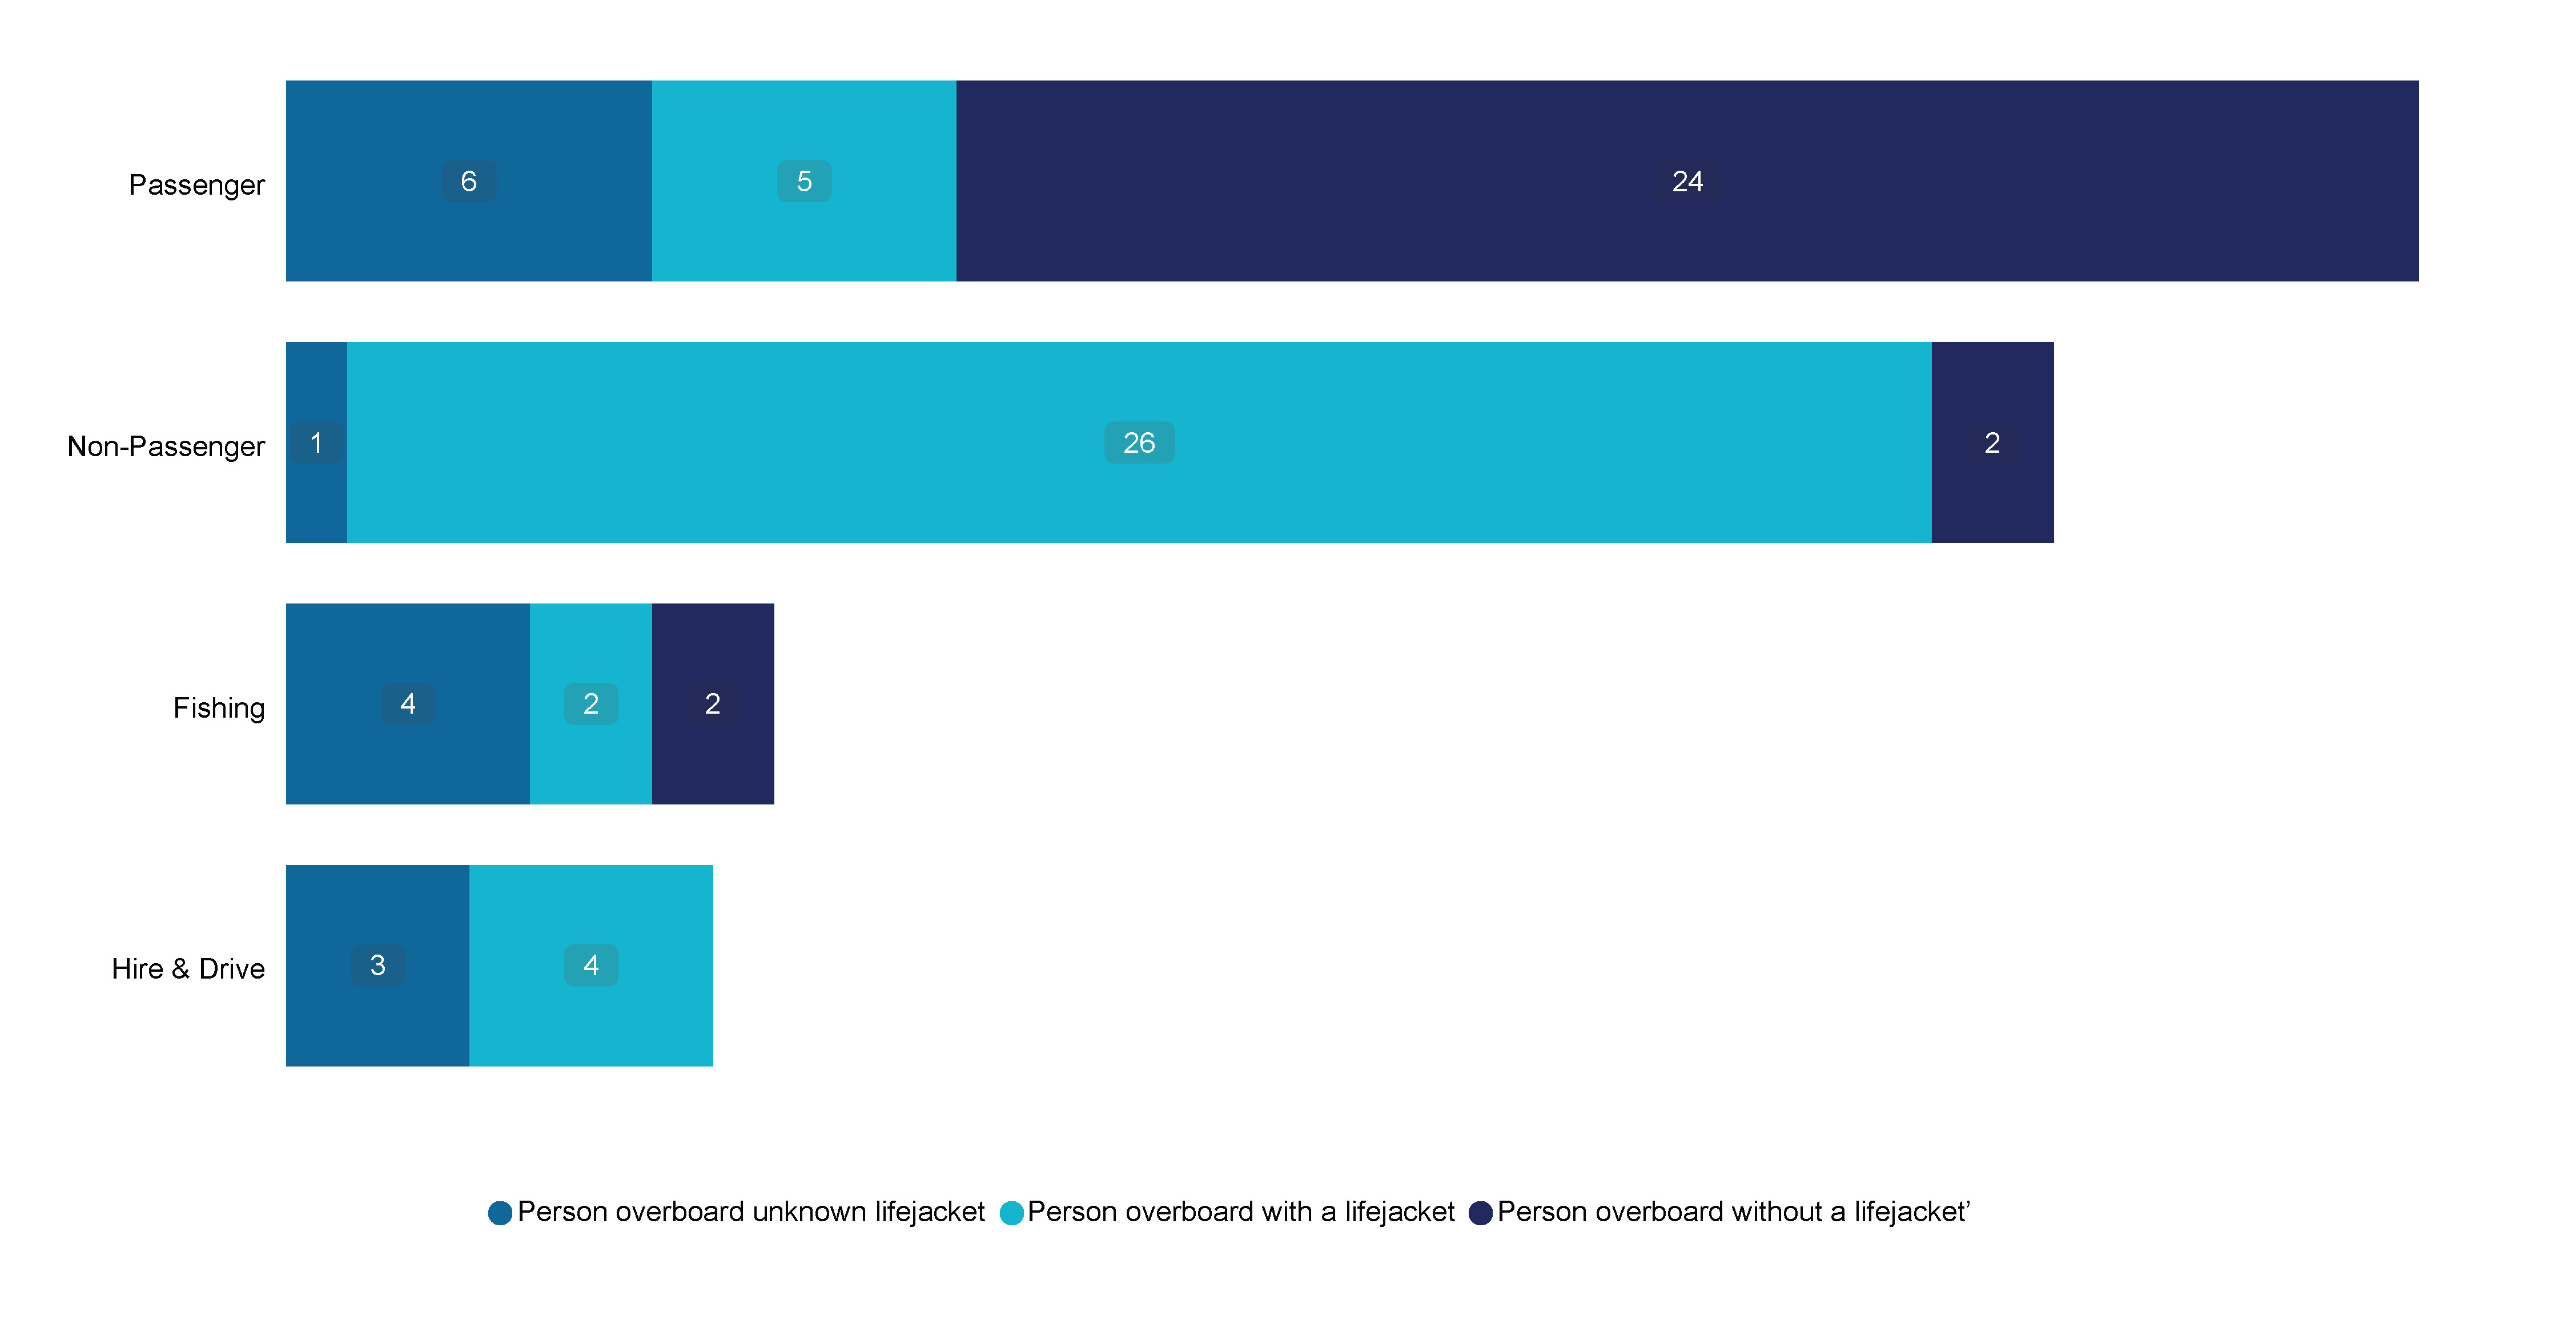
Figure 11 Person overboard incidents showing life jacket status by vessel class (2023)
Figure 12 shows the percentage of unintentional person overboard incidents by vessel length, and as a percentage of the DCV fleet. This graph shows the proportion of unintentional7 person overboard incidents compared to proportion of vessel sizes.
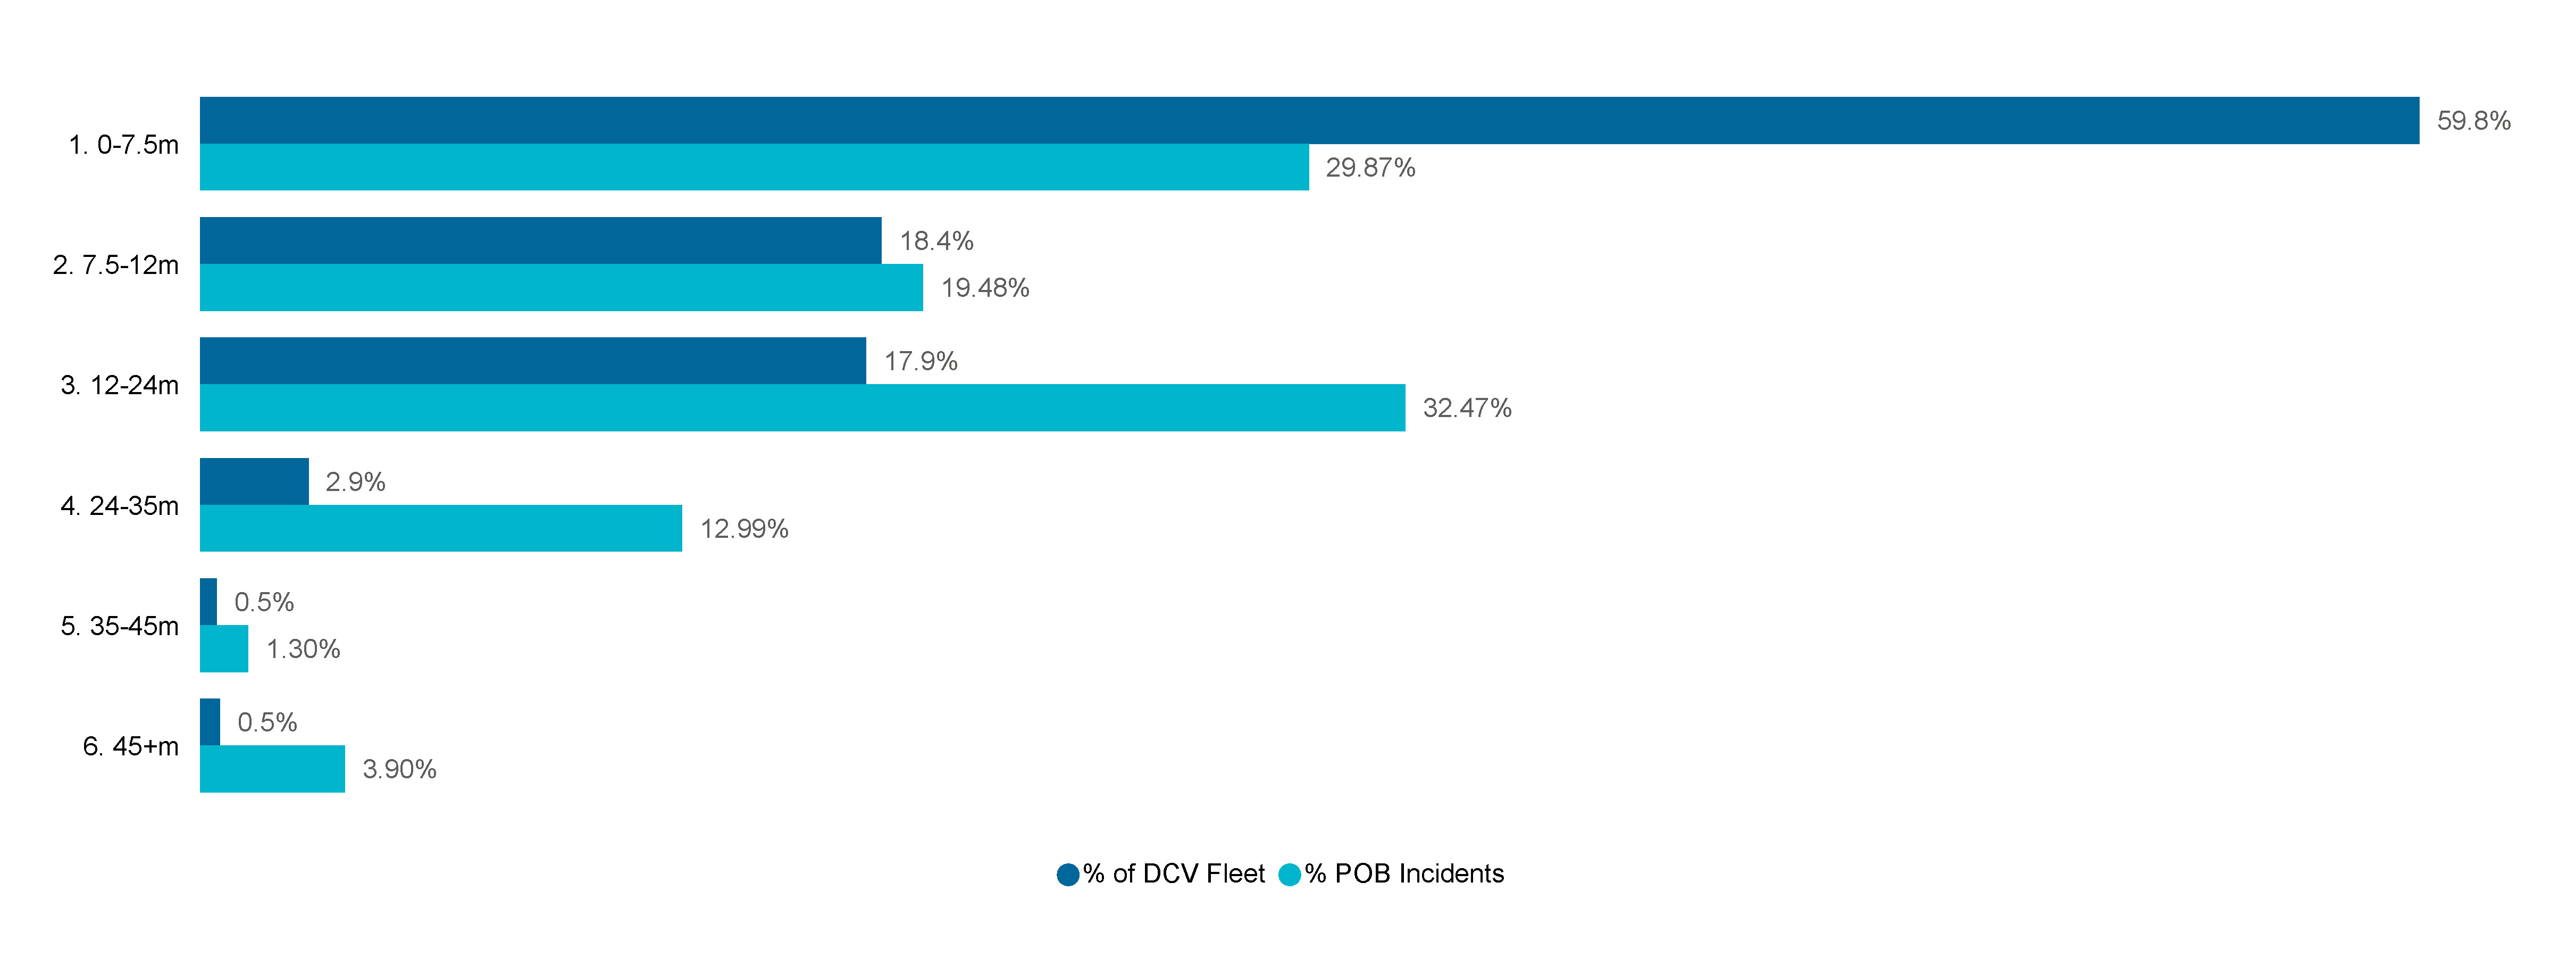
Figure 12 Proportion of DCV fleet and unintentional 7 person overboard incidents by vessel length (2023)
Consequences to vessels
The three most frequently occurring consequences to DCVs in 2023 were contact with something other than a vessel (180 incidents), collisions (125 incidents), and groundings (104 incidents)(Figure 13).
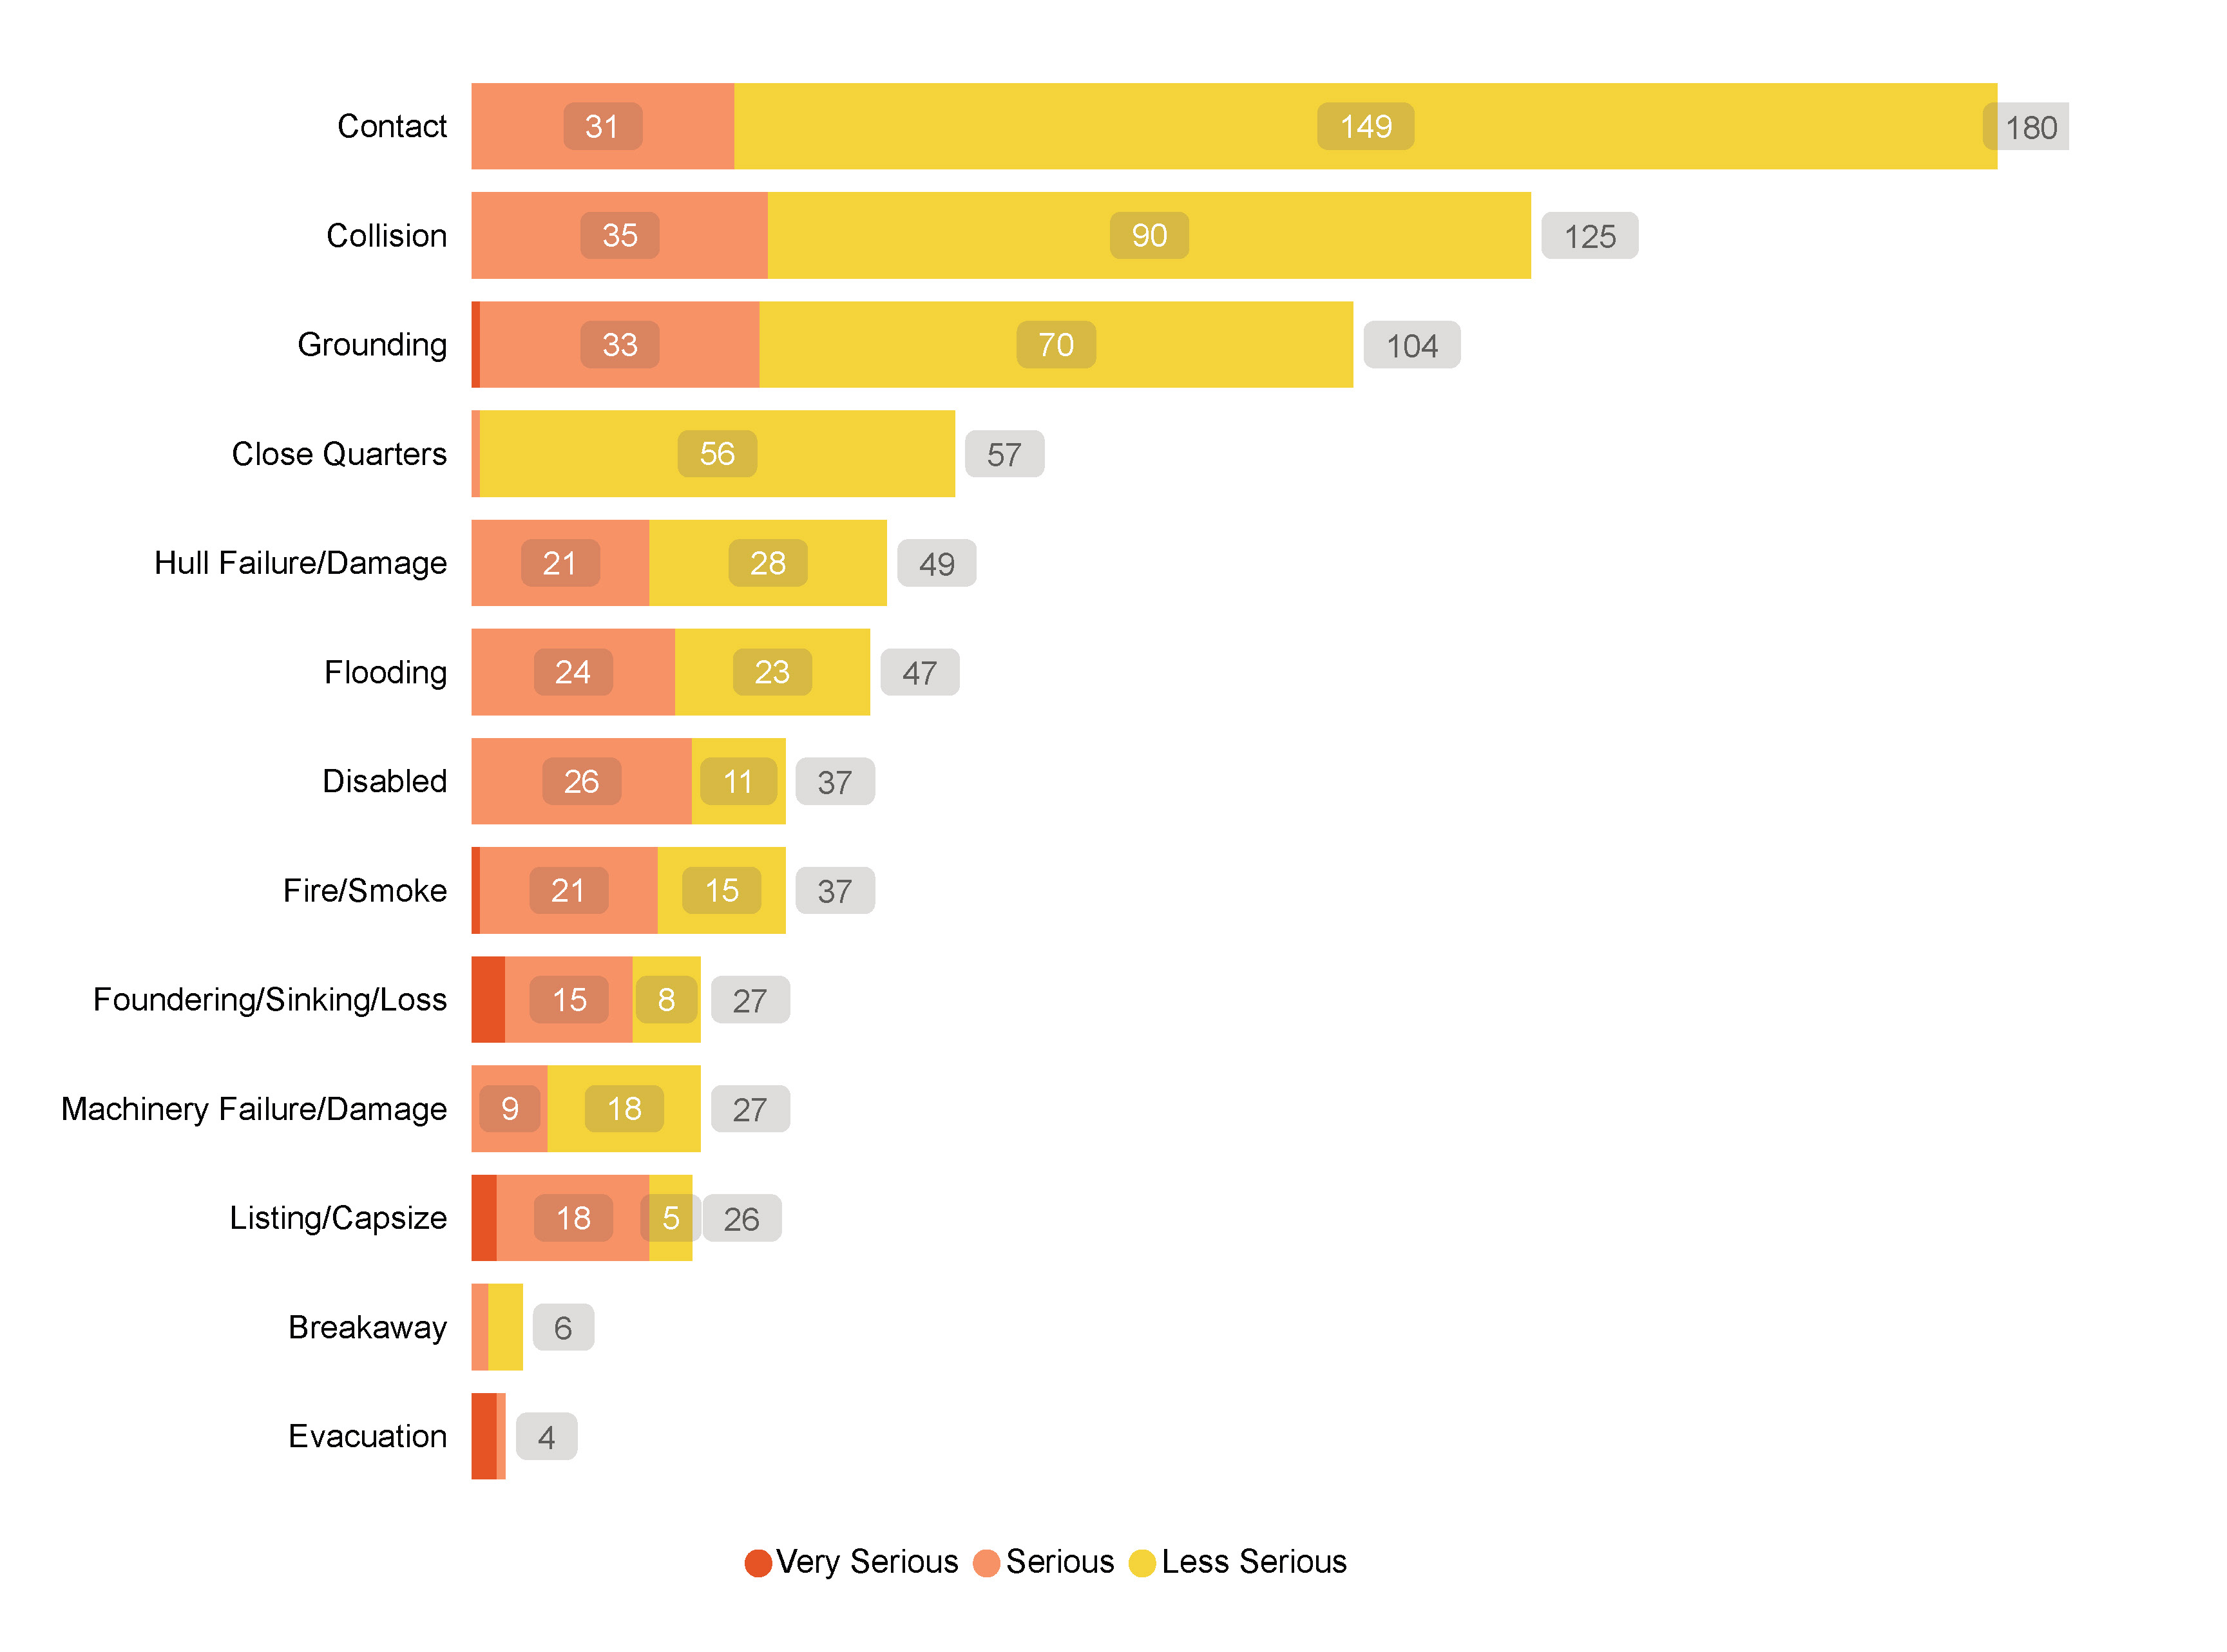
Figure 13 Vessel Consequence Categories by Incident Severity (2023)
Figure 14 shows the trends in the top 3 vessel consequences. The frequency of groundings has remained fairly constant, despite a peak in 2022. Collisions have trended downwards from 15.09% in 2019 to 10.70% in 2023. Contacts with things other than another vessel have generally trended downwards from 15.09% in 2019 to 9.48% in 2023.
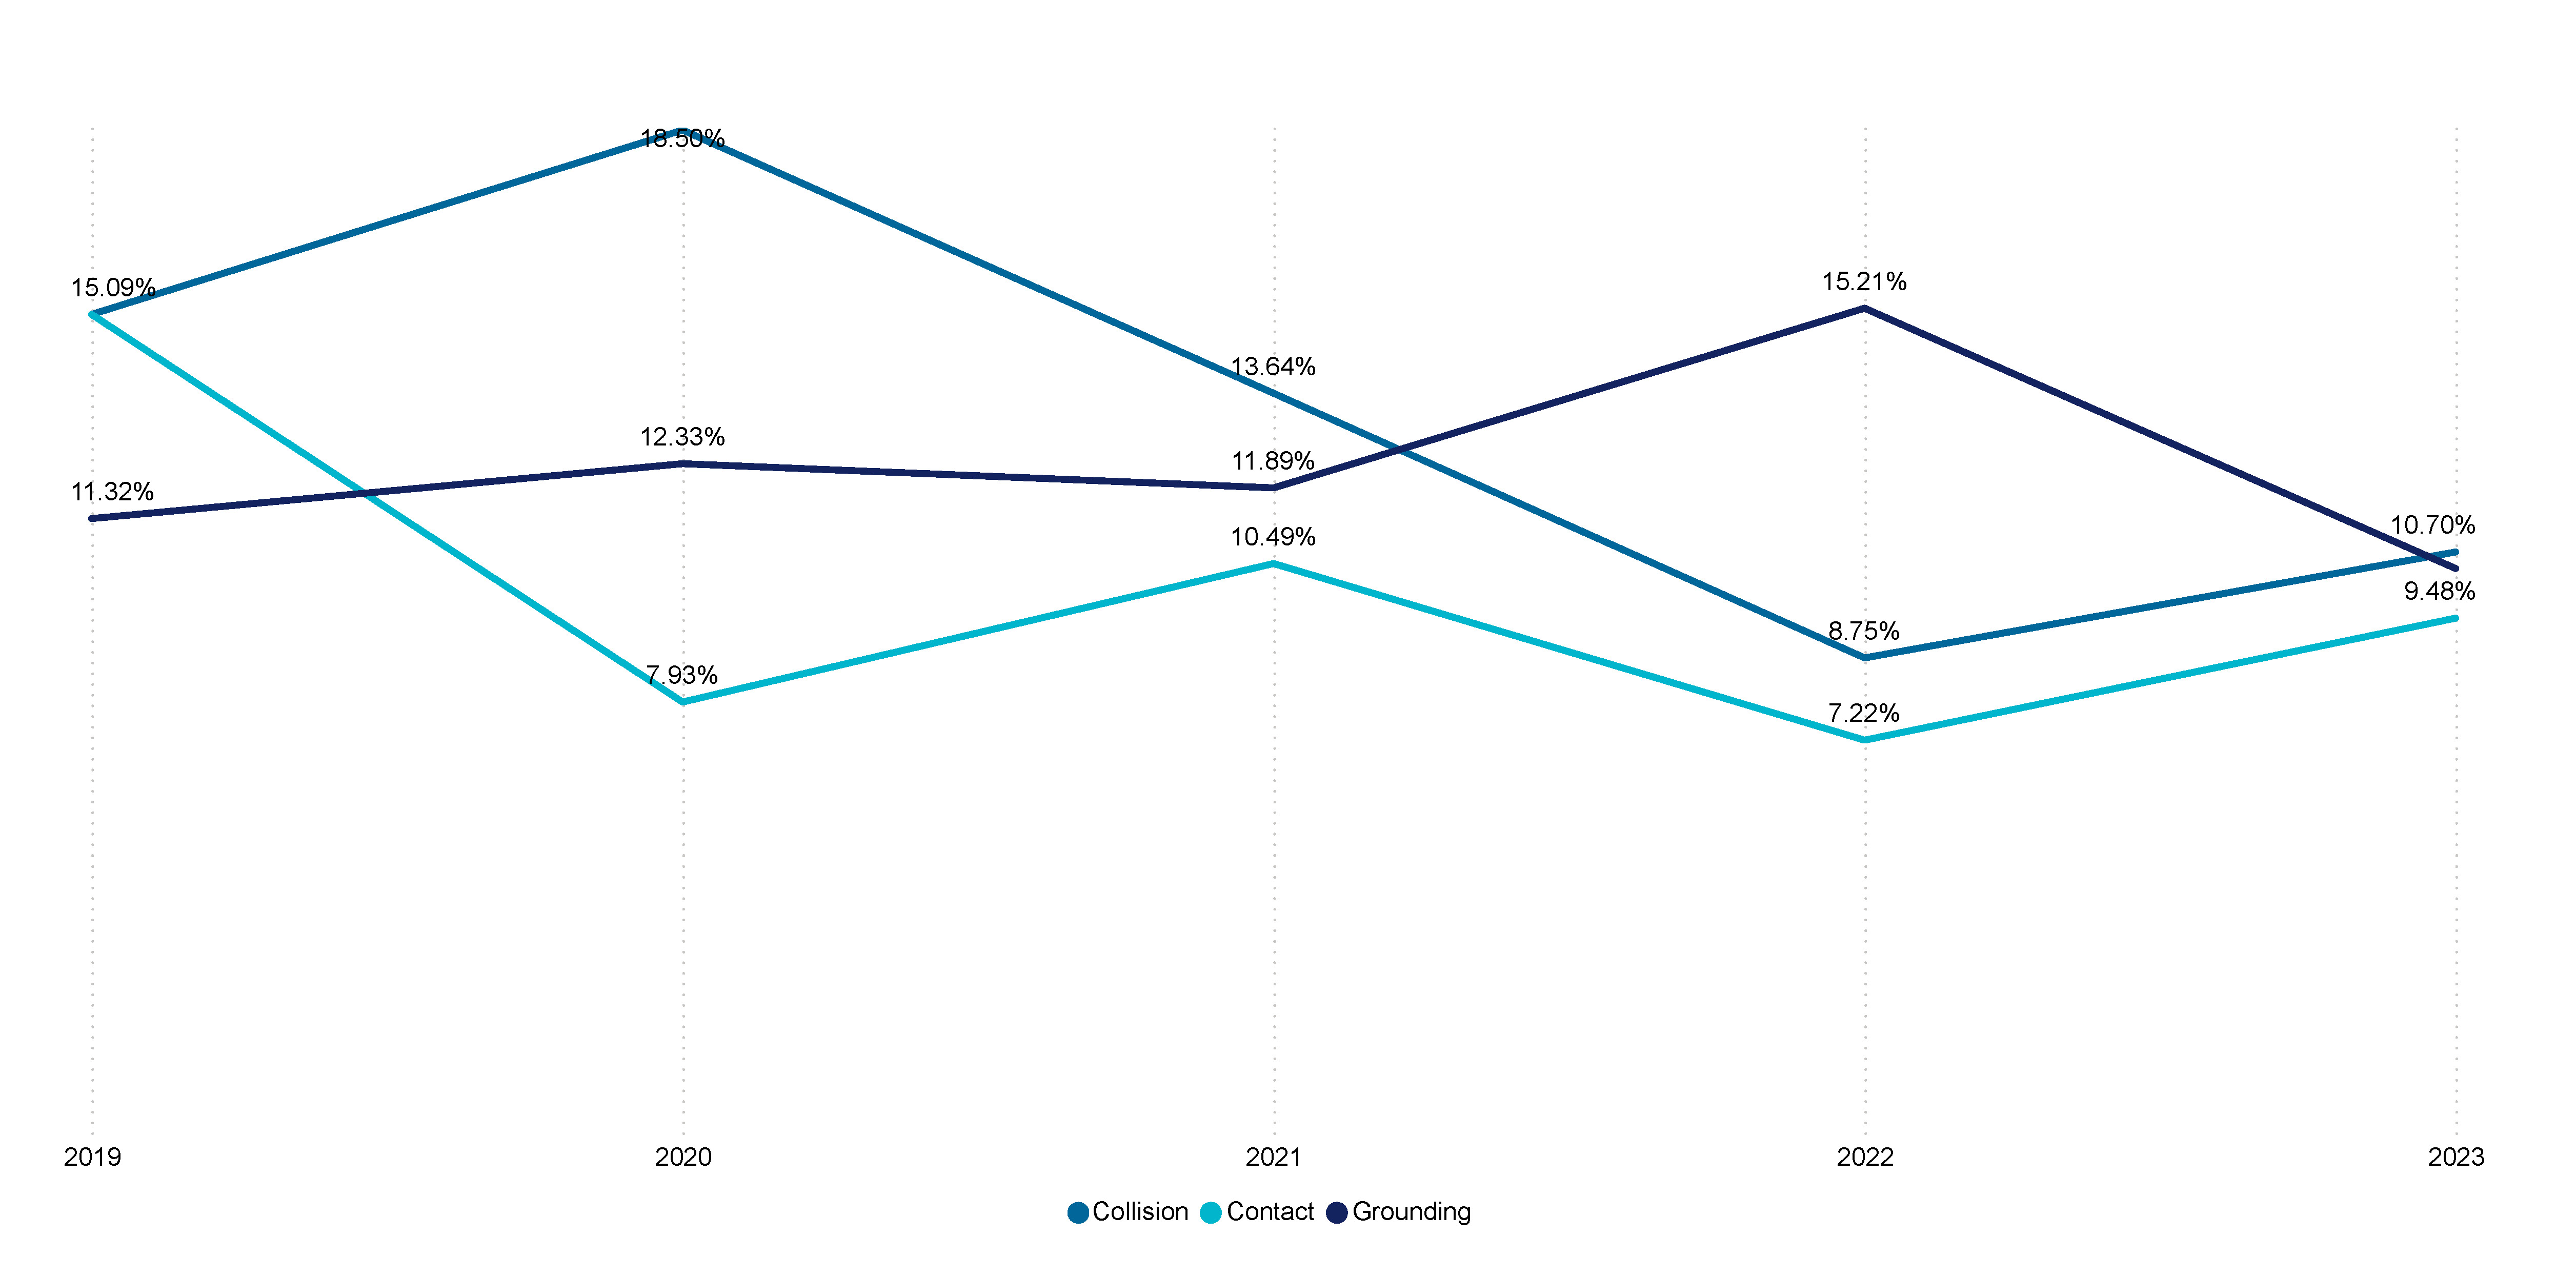
Figure 14 Trends in top 3 vessel consequences (2019-2023)
The most frequently reported very serious and serious vessel consequences by vessel class in 2023 were (Table A5):
- Passenger: Contact (18.7%, 17 out of 91 consequences)
- Non-passenger: Grounding (14.7%, 14 out of 95 consequences)
- Fishing: Flooding (14.3%, 9 out of 63 consequences)
- Hire and drive: Collision (24.2%, 8 out of 33 consequences)
Shortfalls associated with lookout and collision avoidance were reported in 30.2% (101) of vessel consequence incidents, followed by vessel handling and loss of control in 23.1 % (77) and berthing and unberthing in 12.9% (43) (Figure15).
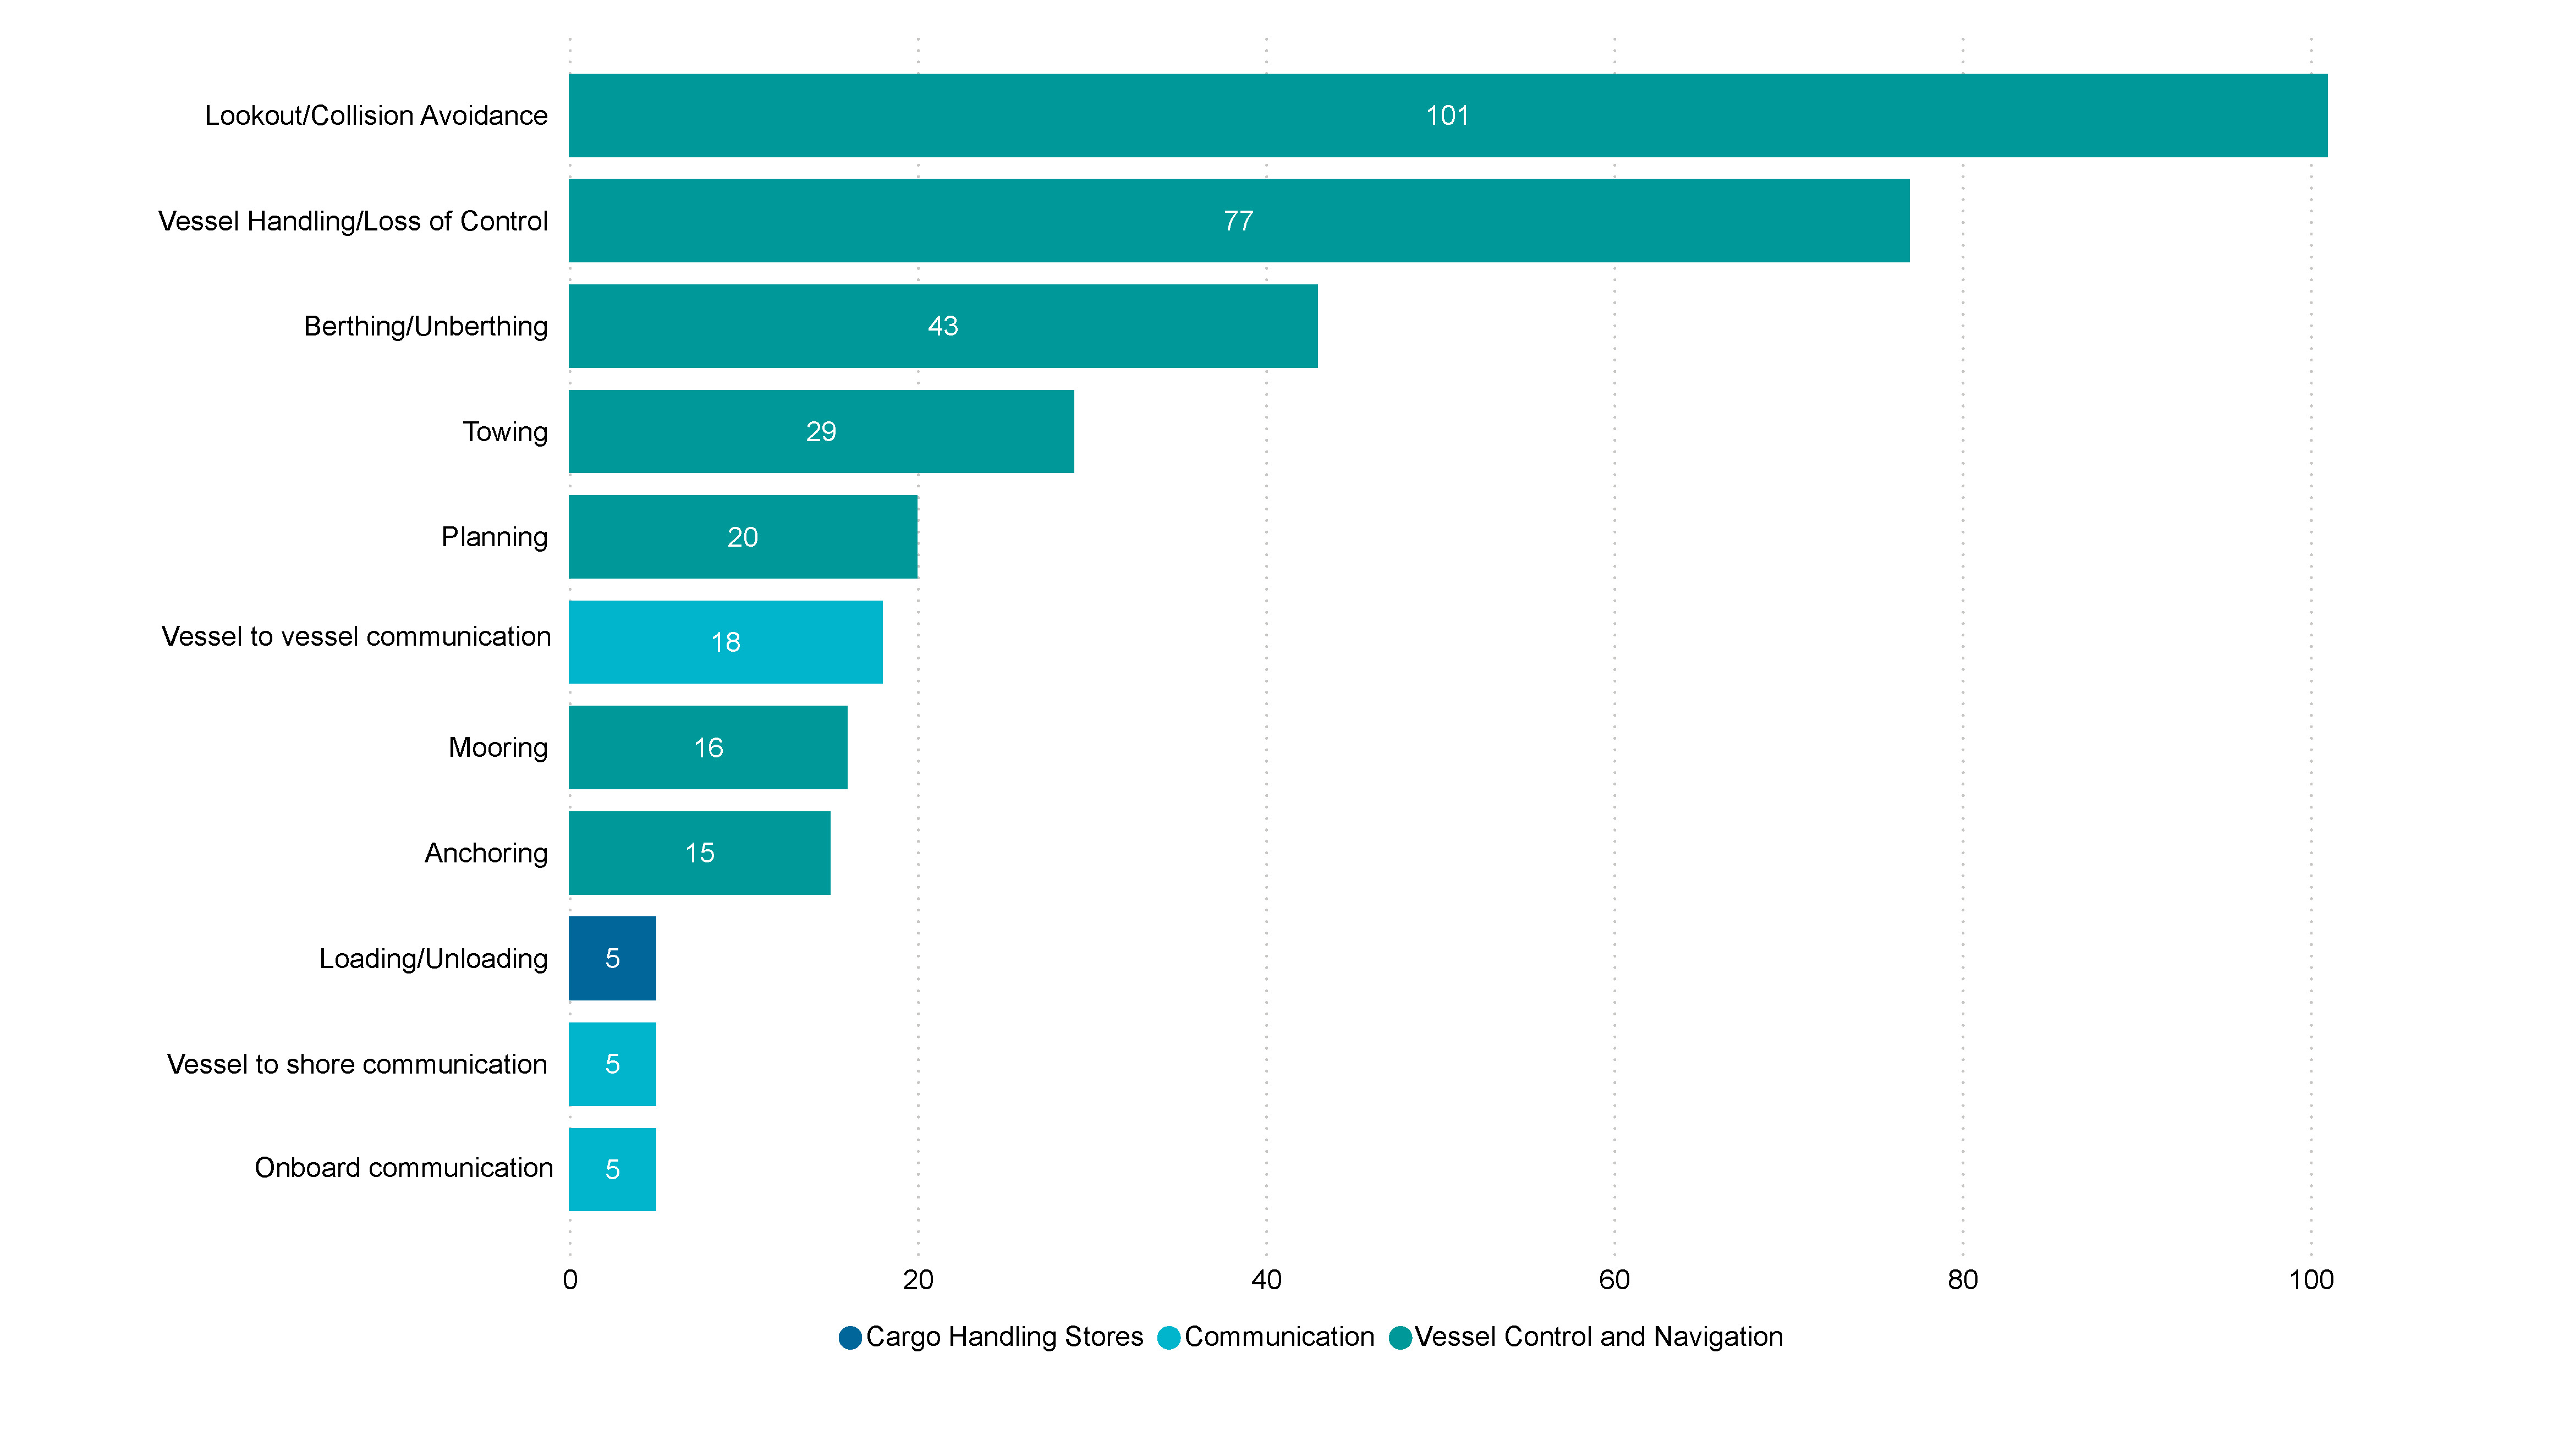
Figure 15 Top 10 Occurrence Types Associated with Incidents Involving Vessel Consequences (2023)
Trends in Operational occurrence types
Over half of DCV marine incidents reported between 2019-2023 relate to the operation of the vessel. Most of the very serious/serious incidents were associated with vessel control and navigation, cargo handling, and operational access (Figure 16).
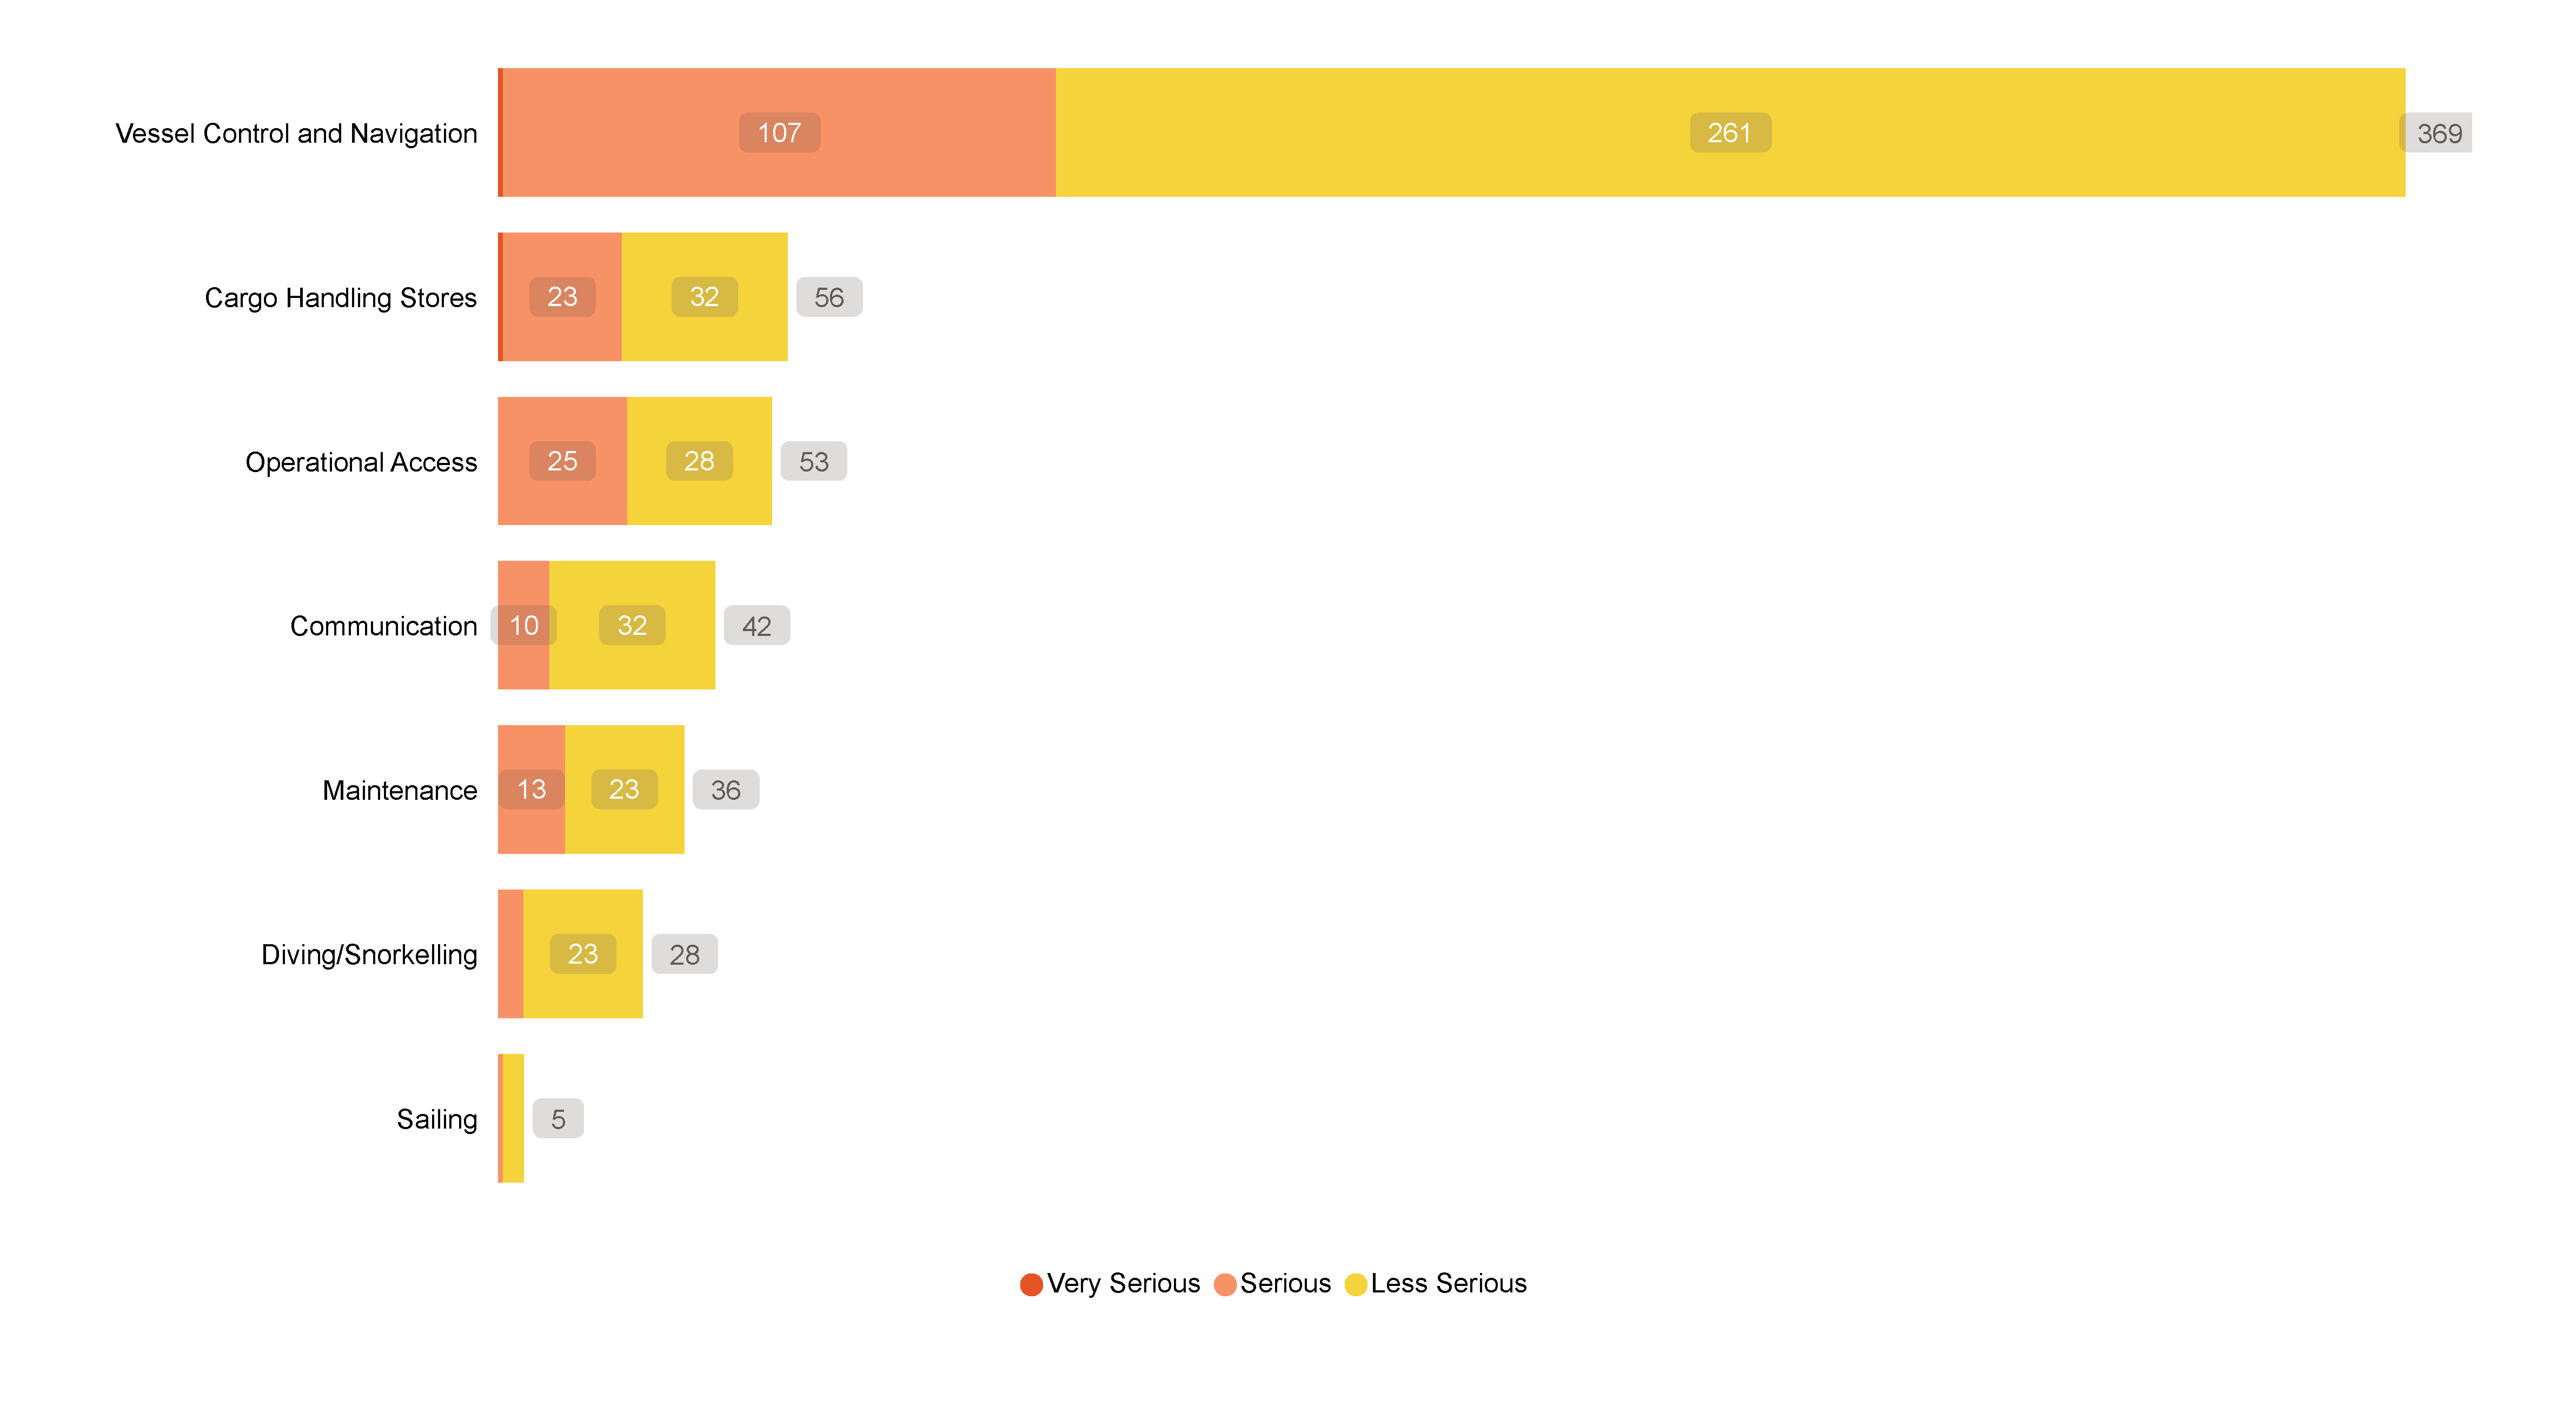
Figure 16 Operational Occurrence Type by Incident Severity (2023)
In 2023, 62.6% (369 out of 589) of incidents were associated with vessel control and navigation (Figure 16). 29.0% of these were categorised as serious. This is consistent with the 2019-2022 data, in which the 5 top operational issues for every vessel class had control and navigation operational failure at the top of the list (Table A6). There was variance across vessel classes as to the second largest operational shortfall, being operational access (passenger and non-passenger vessel classes), cargo handling (fishing vessels) and communication (hire and drive).
In unpacking the sub-elements of vessel control and navigation, incident data between 2019-23, lookout and collision avoidance is the major operational occurrence type related to vessel control and navigation at 33.6% (560) of the 1665 incidents, while 32.7% (545) were associated with vessel handling and loss of control, and 11.1% (185) with berthing/unberthing (Figure 17).
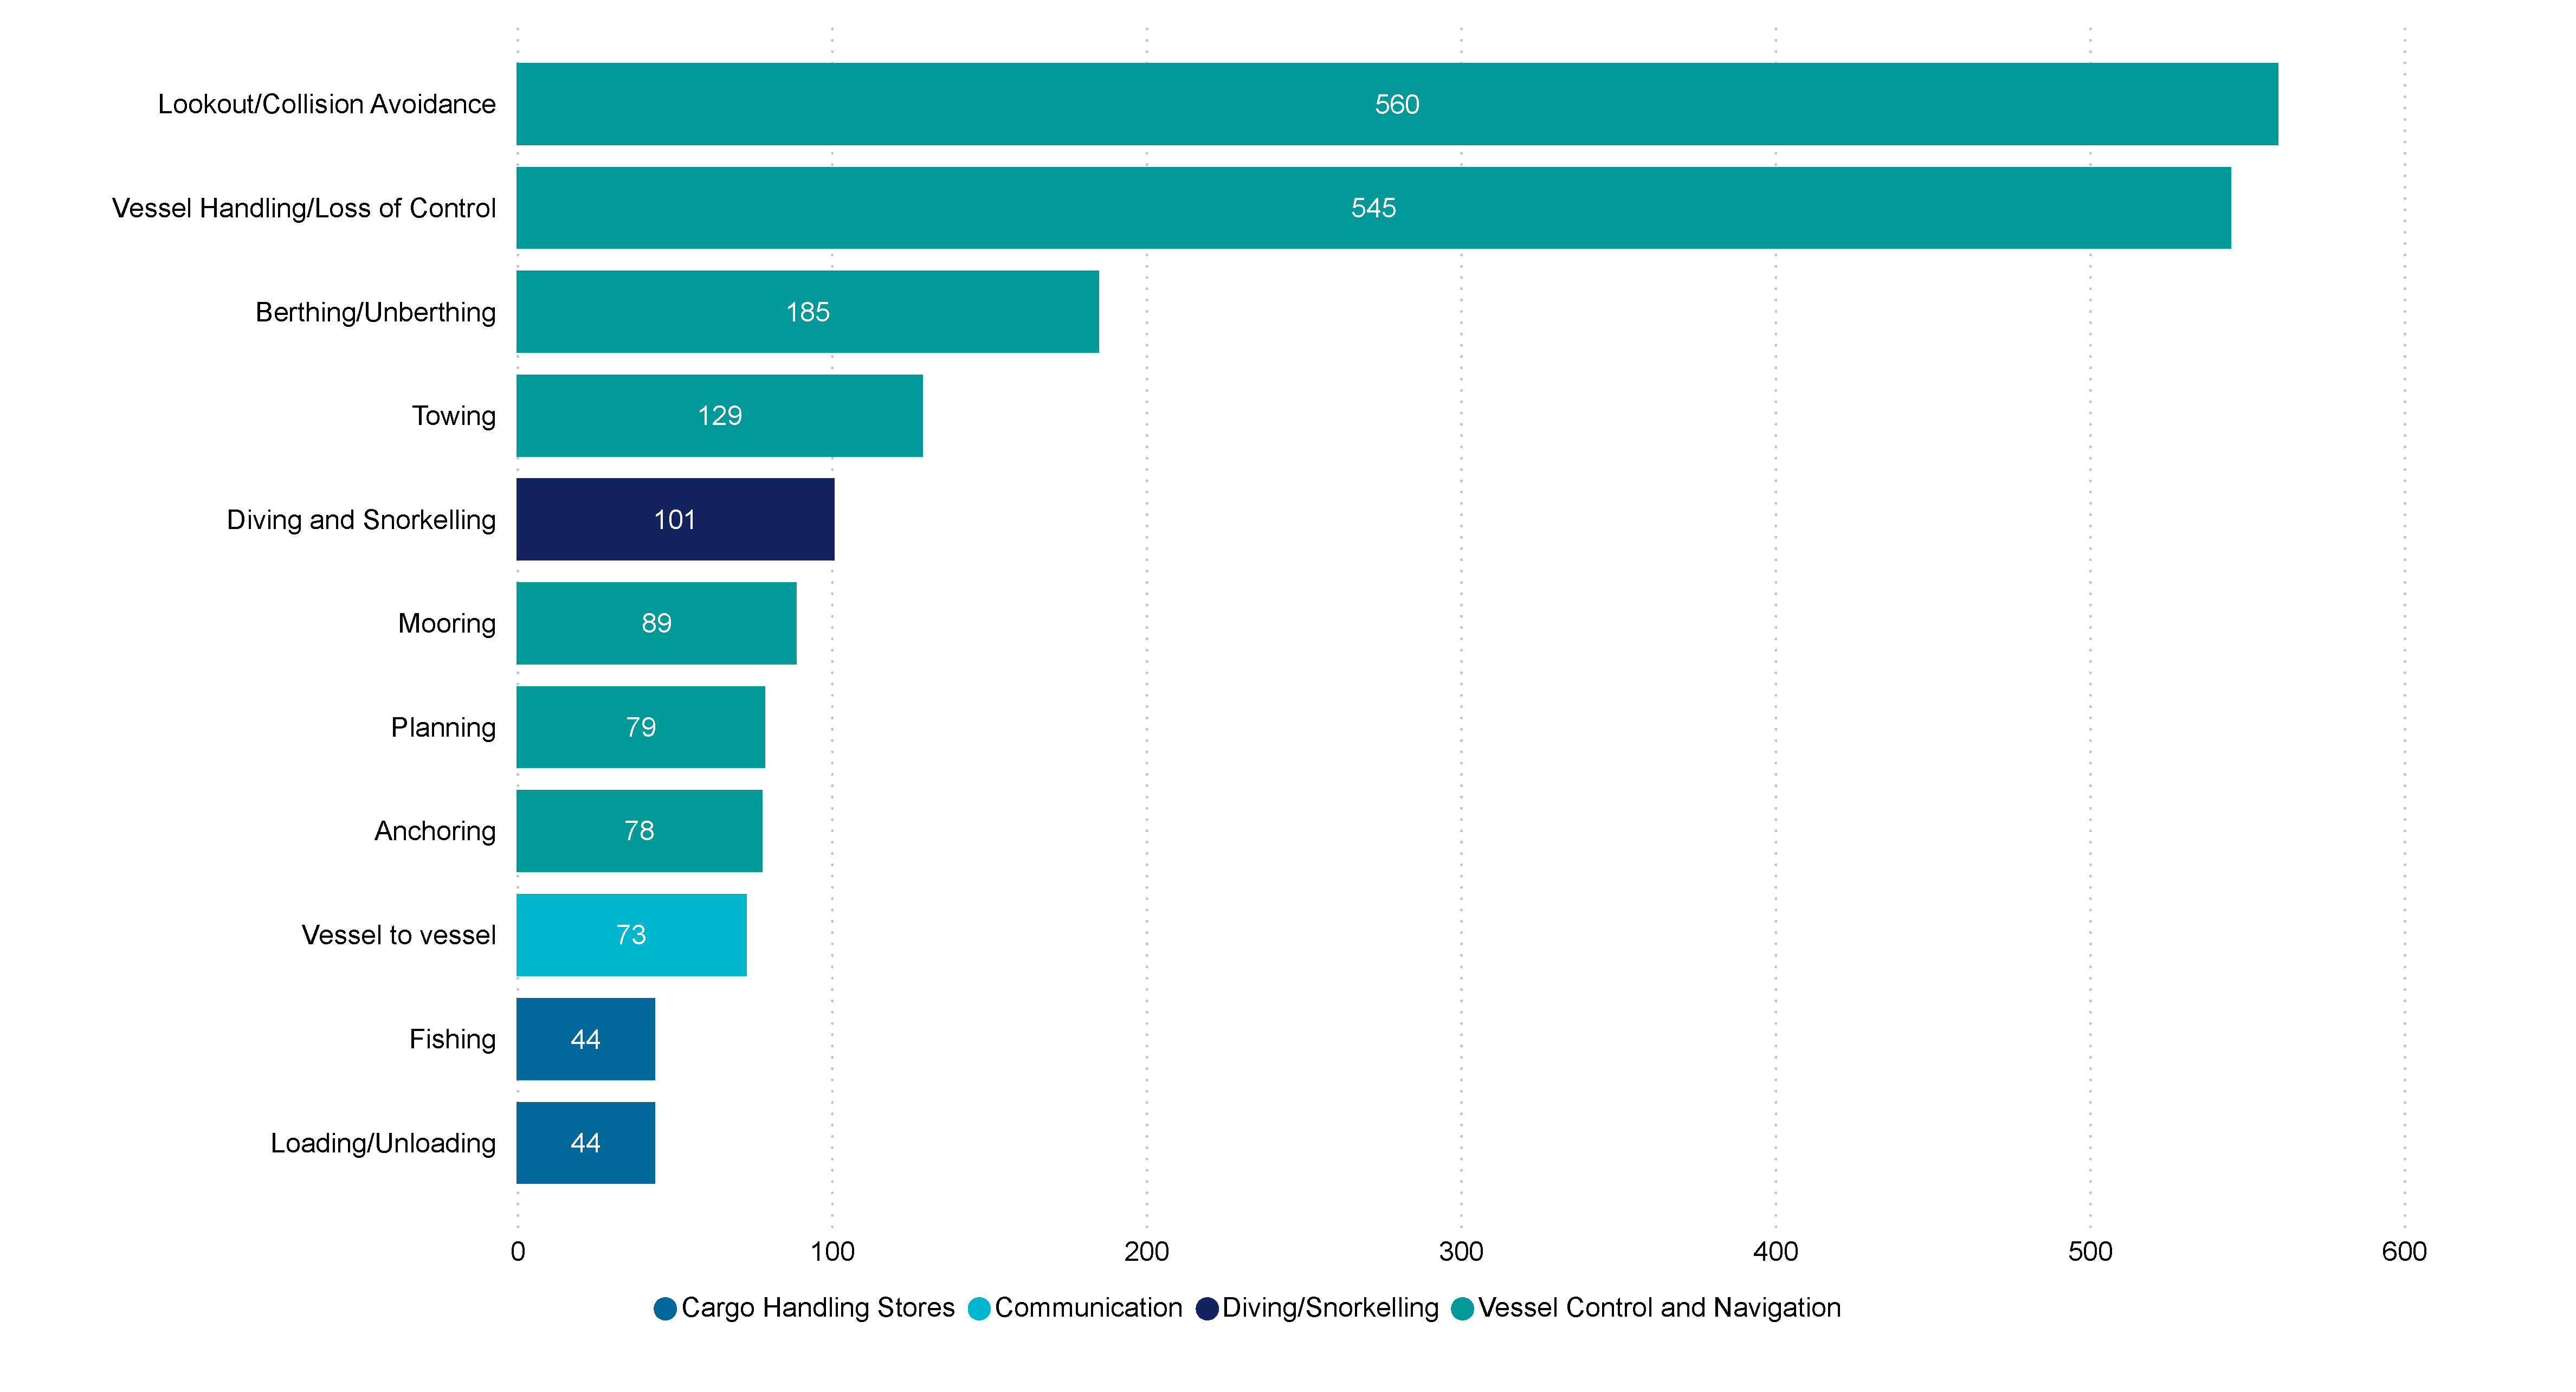
Figure 17 Top 10 Operational occurrence types with sub-category (2019-23)
Trends in Technical occurrence types
Figure 18 shows the trends in technical occurrence types between 2019-2023. In 2023 (80), there was a 73.9% increase in engineering system failures from 2022 (46). Power, propulsion and steering failures have been the major occurrence in all years with a noticeable peak in 2021 (152) and 2022 (166), and a downward trend in 2023 (199).
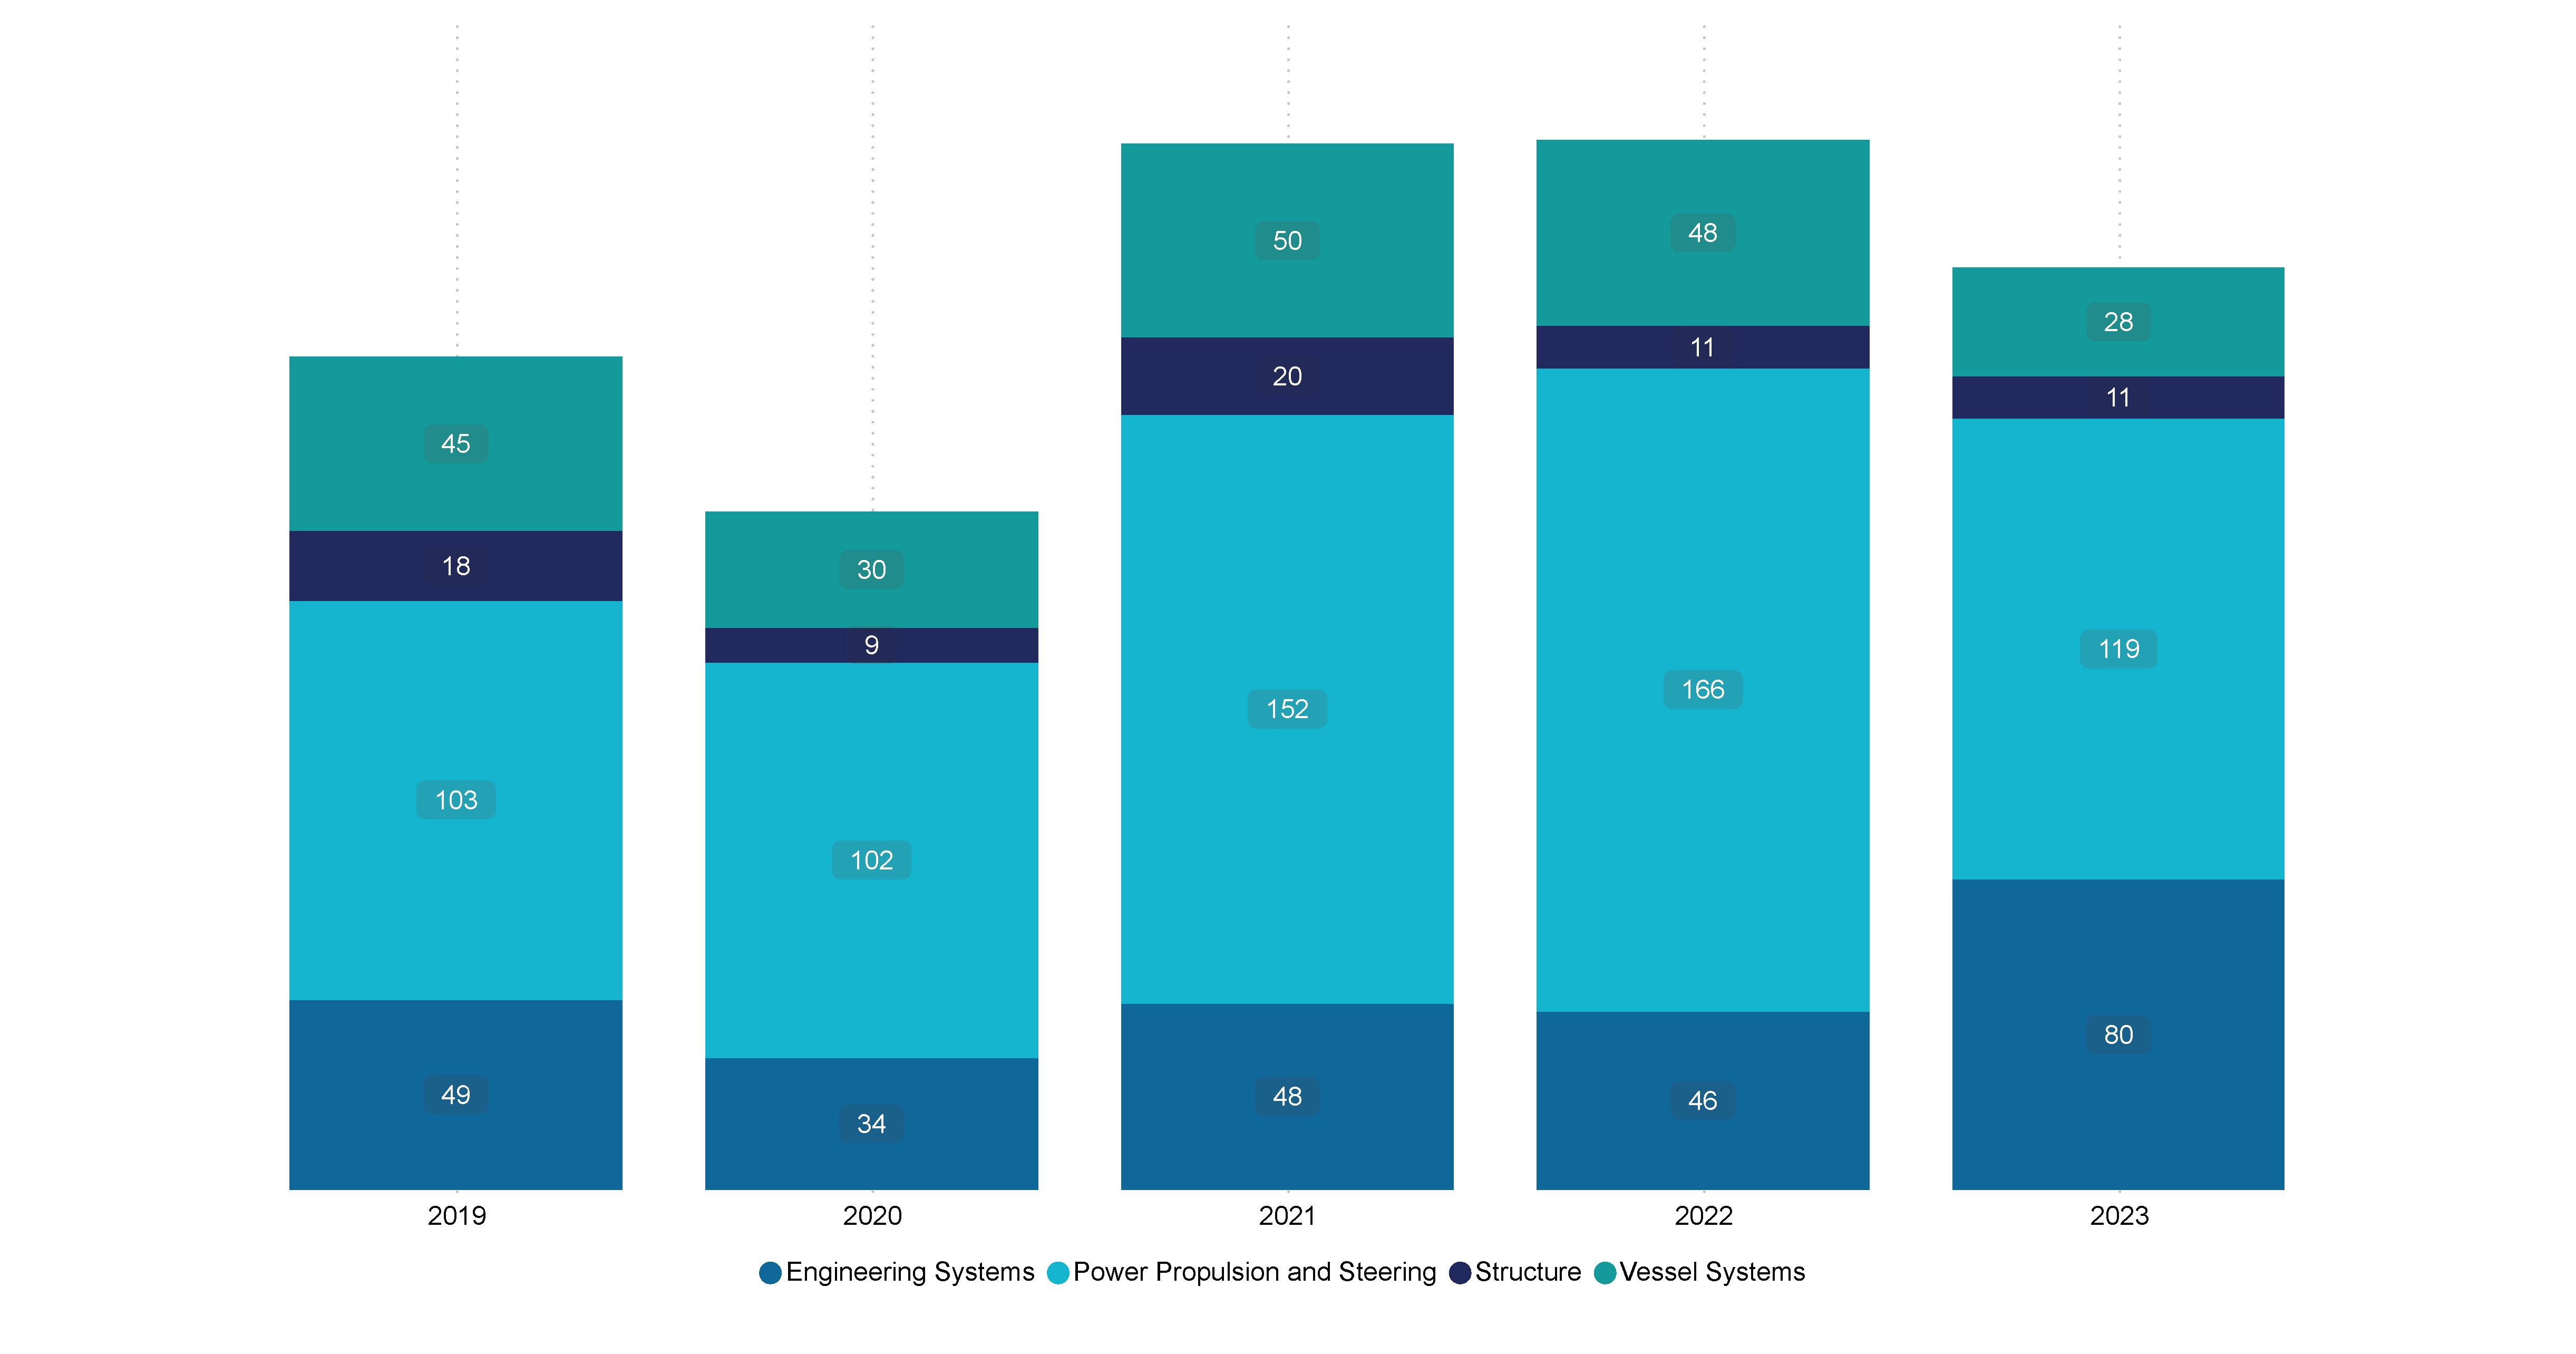
Figure 18 Technical occurrence types by incident severity (2019-23)
The majority of power, propulsion and steering failures in 2023 were main engine and/or gearing failures (50.4% (60 out of 119), followed by steering gear failure at 19.3% (23) (Figure 19).
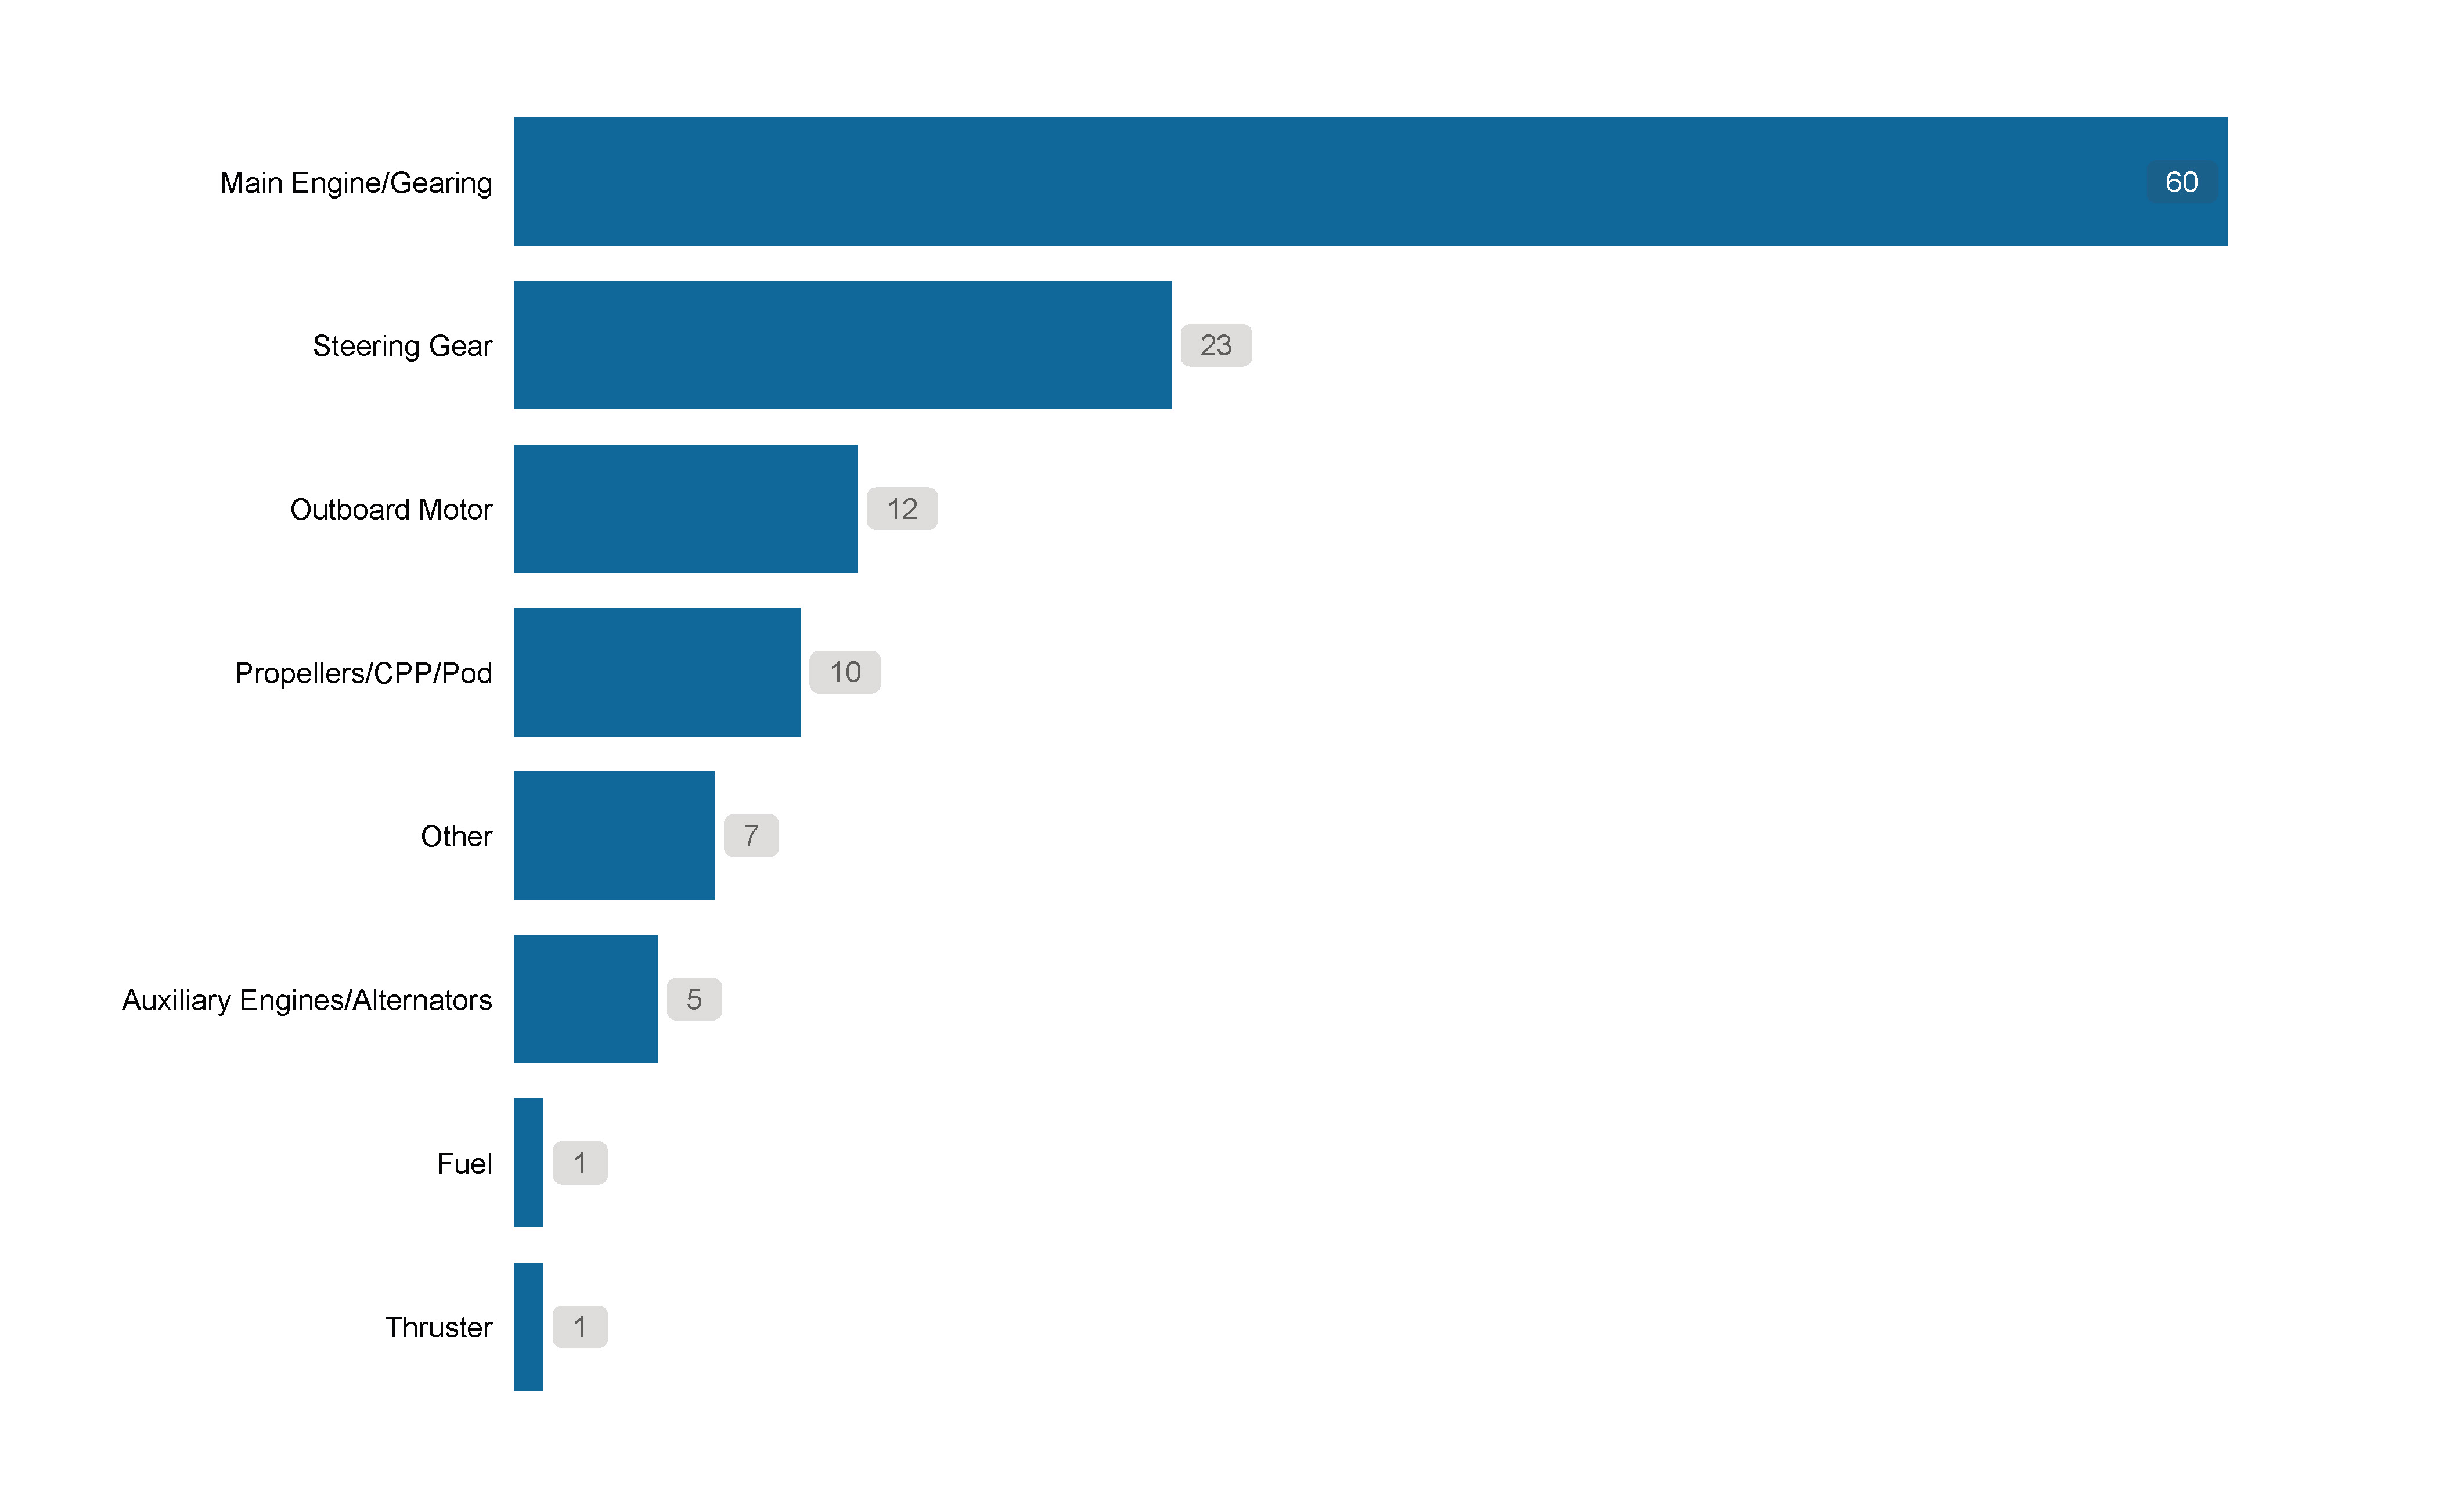
Figure 19 Power, propulsion, and steering failure types (2023)
Safety framework coding analysis
This section presents the findings from the safety framework coding of DCV investigation reports. The findings provide an understanding of safety issues and identifies if, and where, greater compliance focus needs to be applied.
Between 2020 and 2023, 240 DCV investigation reports were coded using the safety framework. A total of 641 safety factors were identified across the 240 investigation reports analysed8.
From the 240 investigations coded, the majority of personal and vessel consequences were crew injuries (12.5% (64)) followed by contacts (10.2% (52)), groundings (10.2% (52)) and collisions (9.2% (47) (Figure 20).
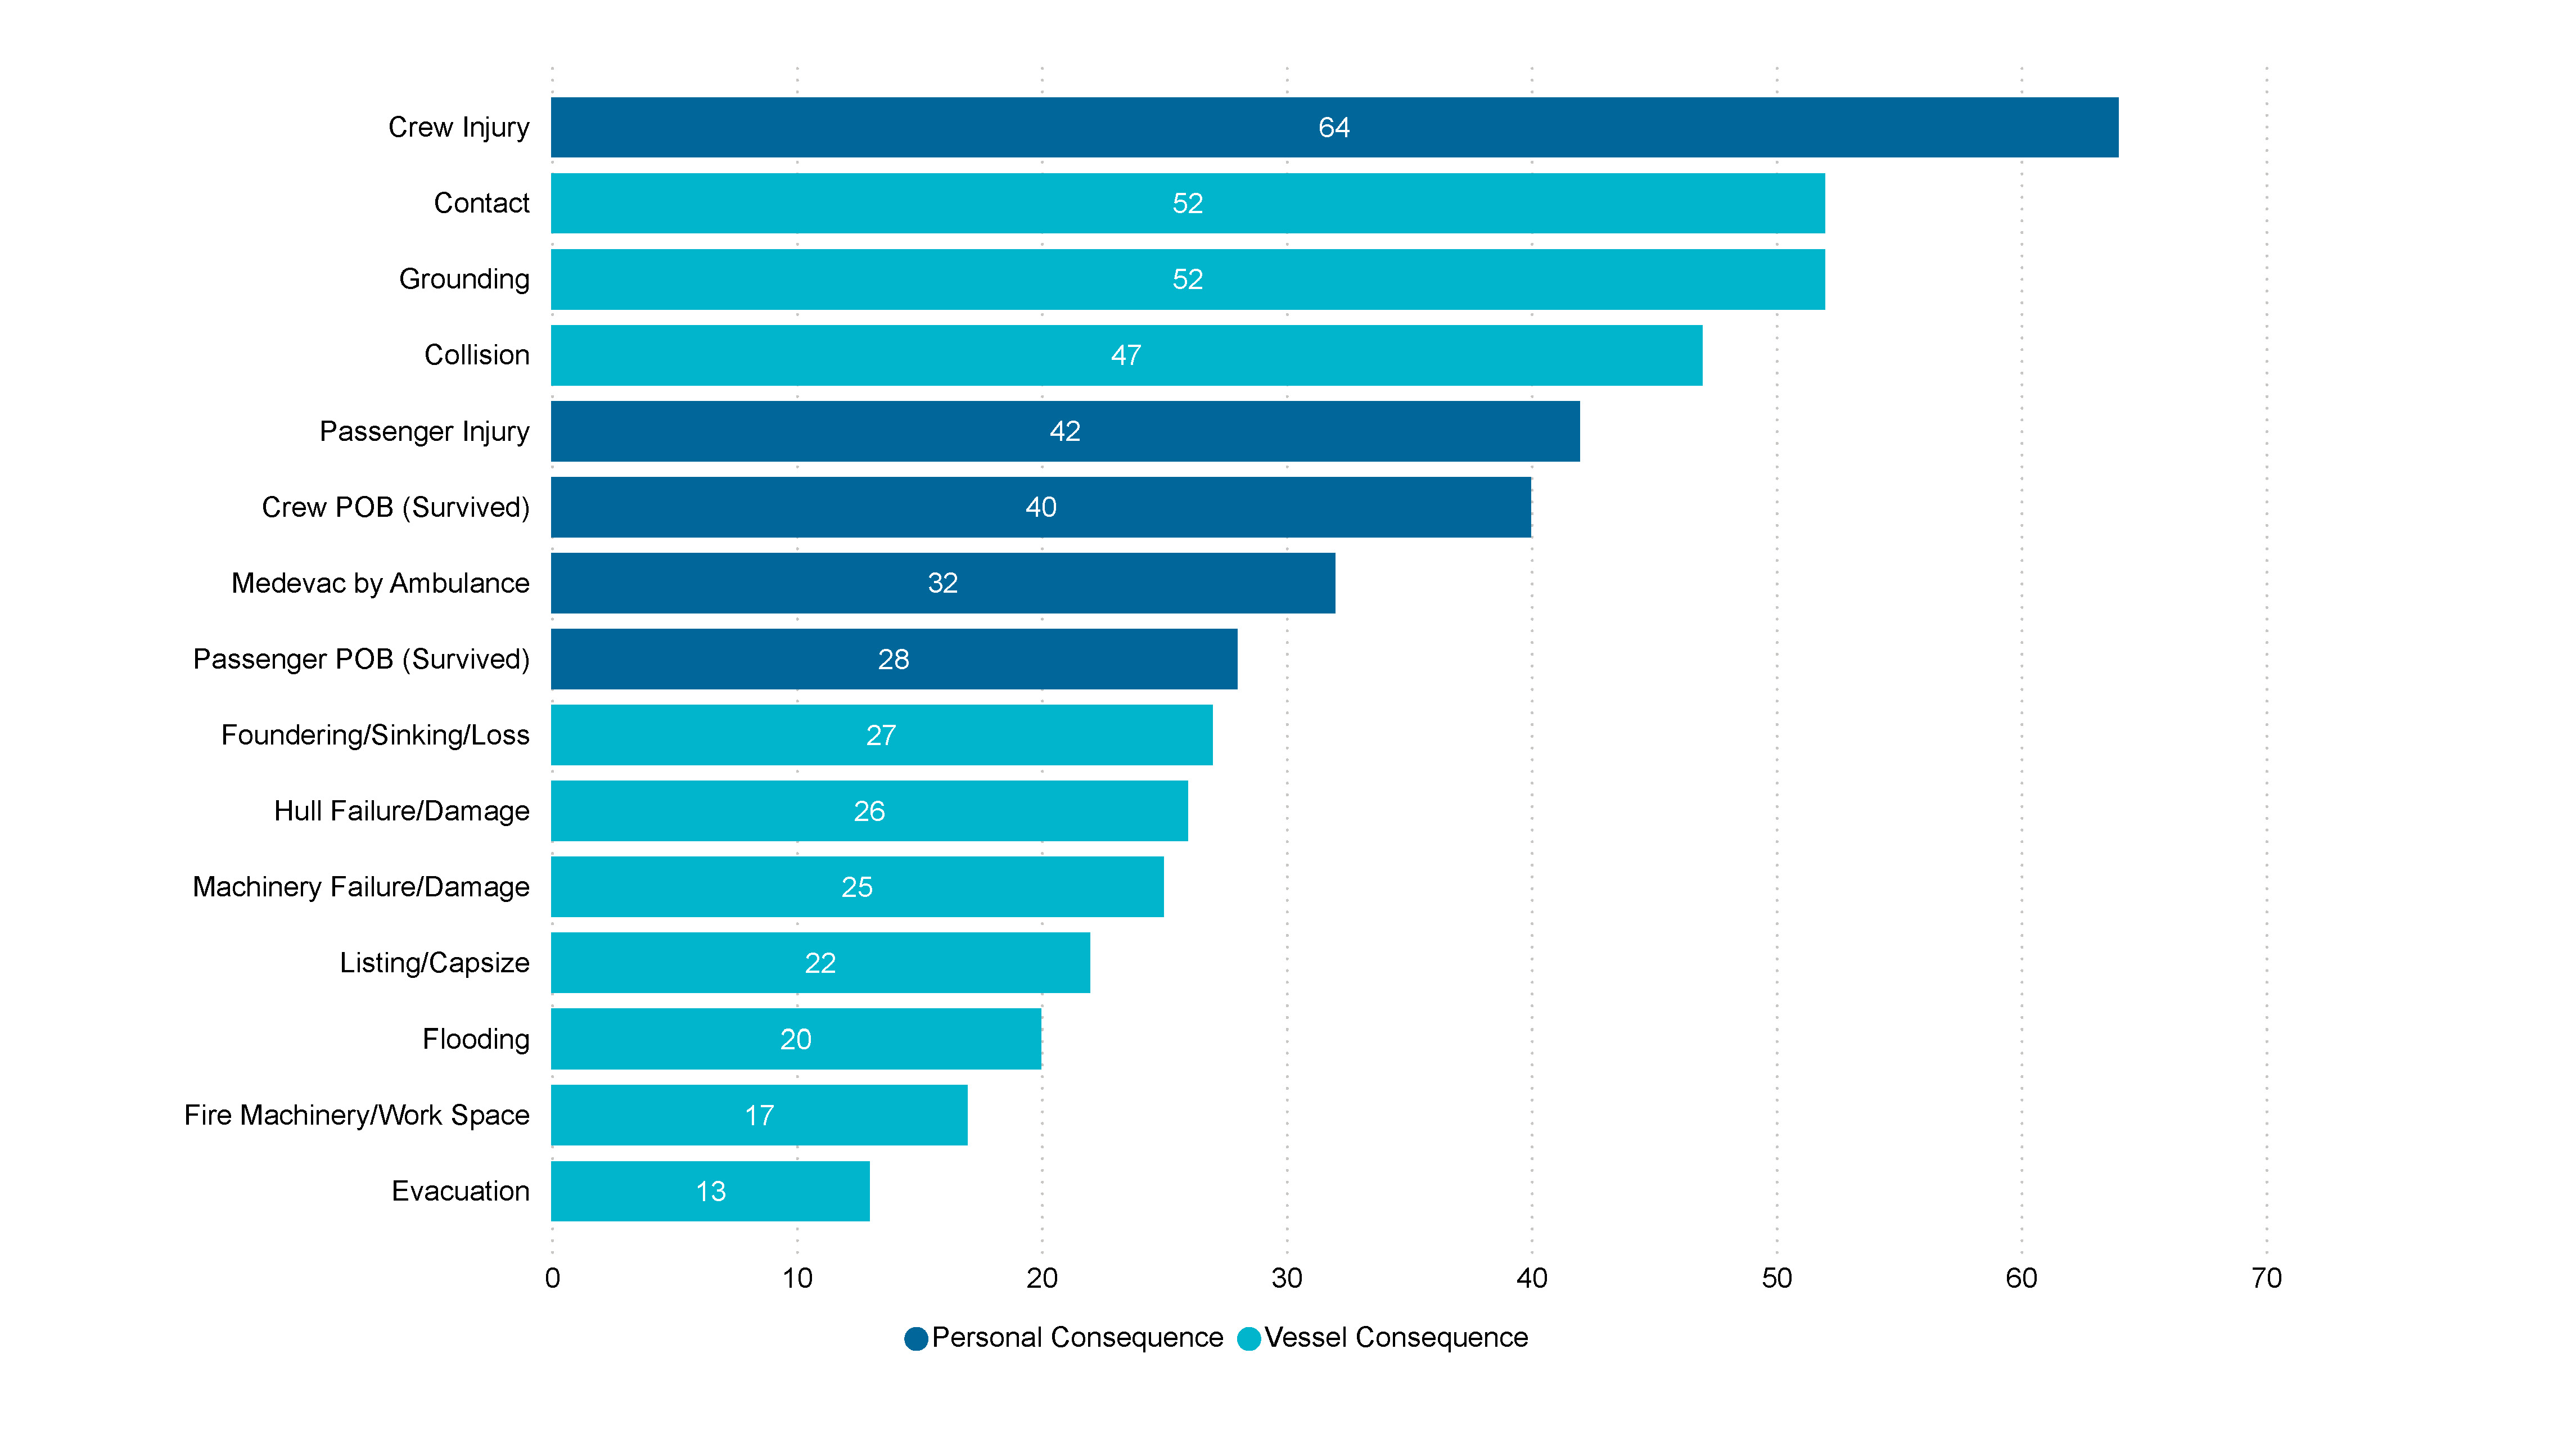
Figure 20 Most frequent consequence events from the 240 coded investigation reports (2020-2023)
Aspects related to people at 24.6% (159), and internal organisational issues at 26.2% (169) continue to form the majority of safety factors (Figure 21).
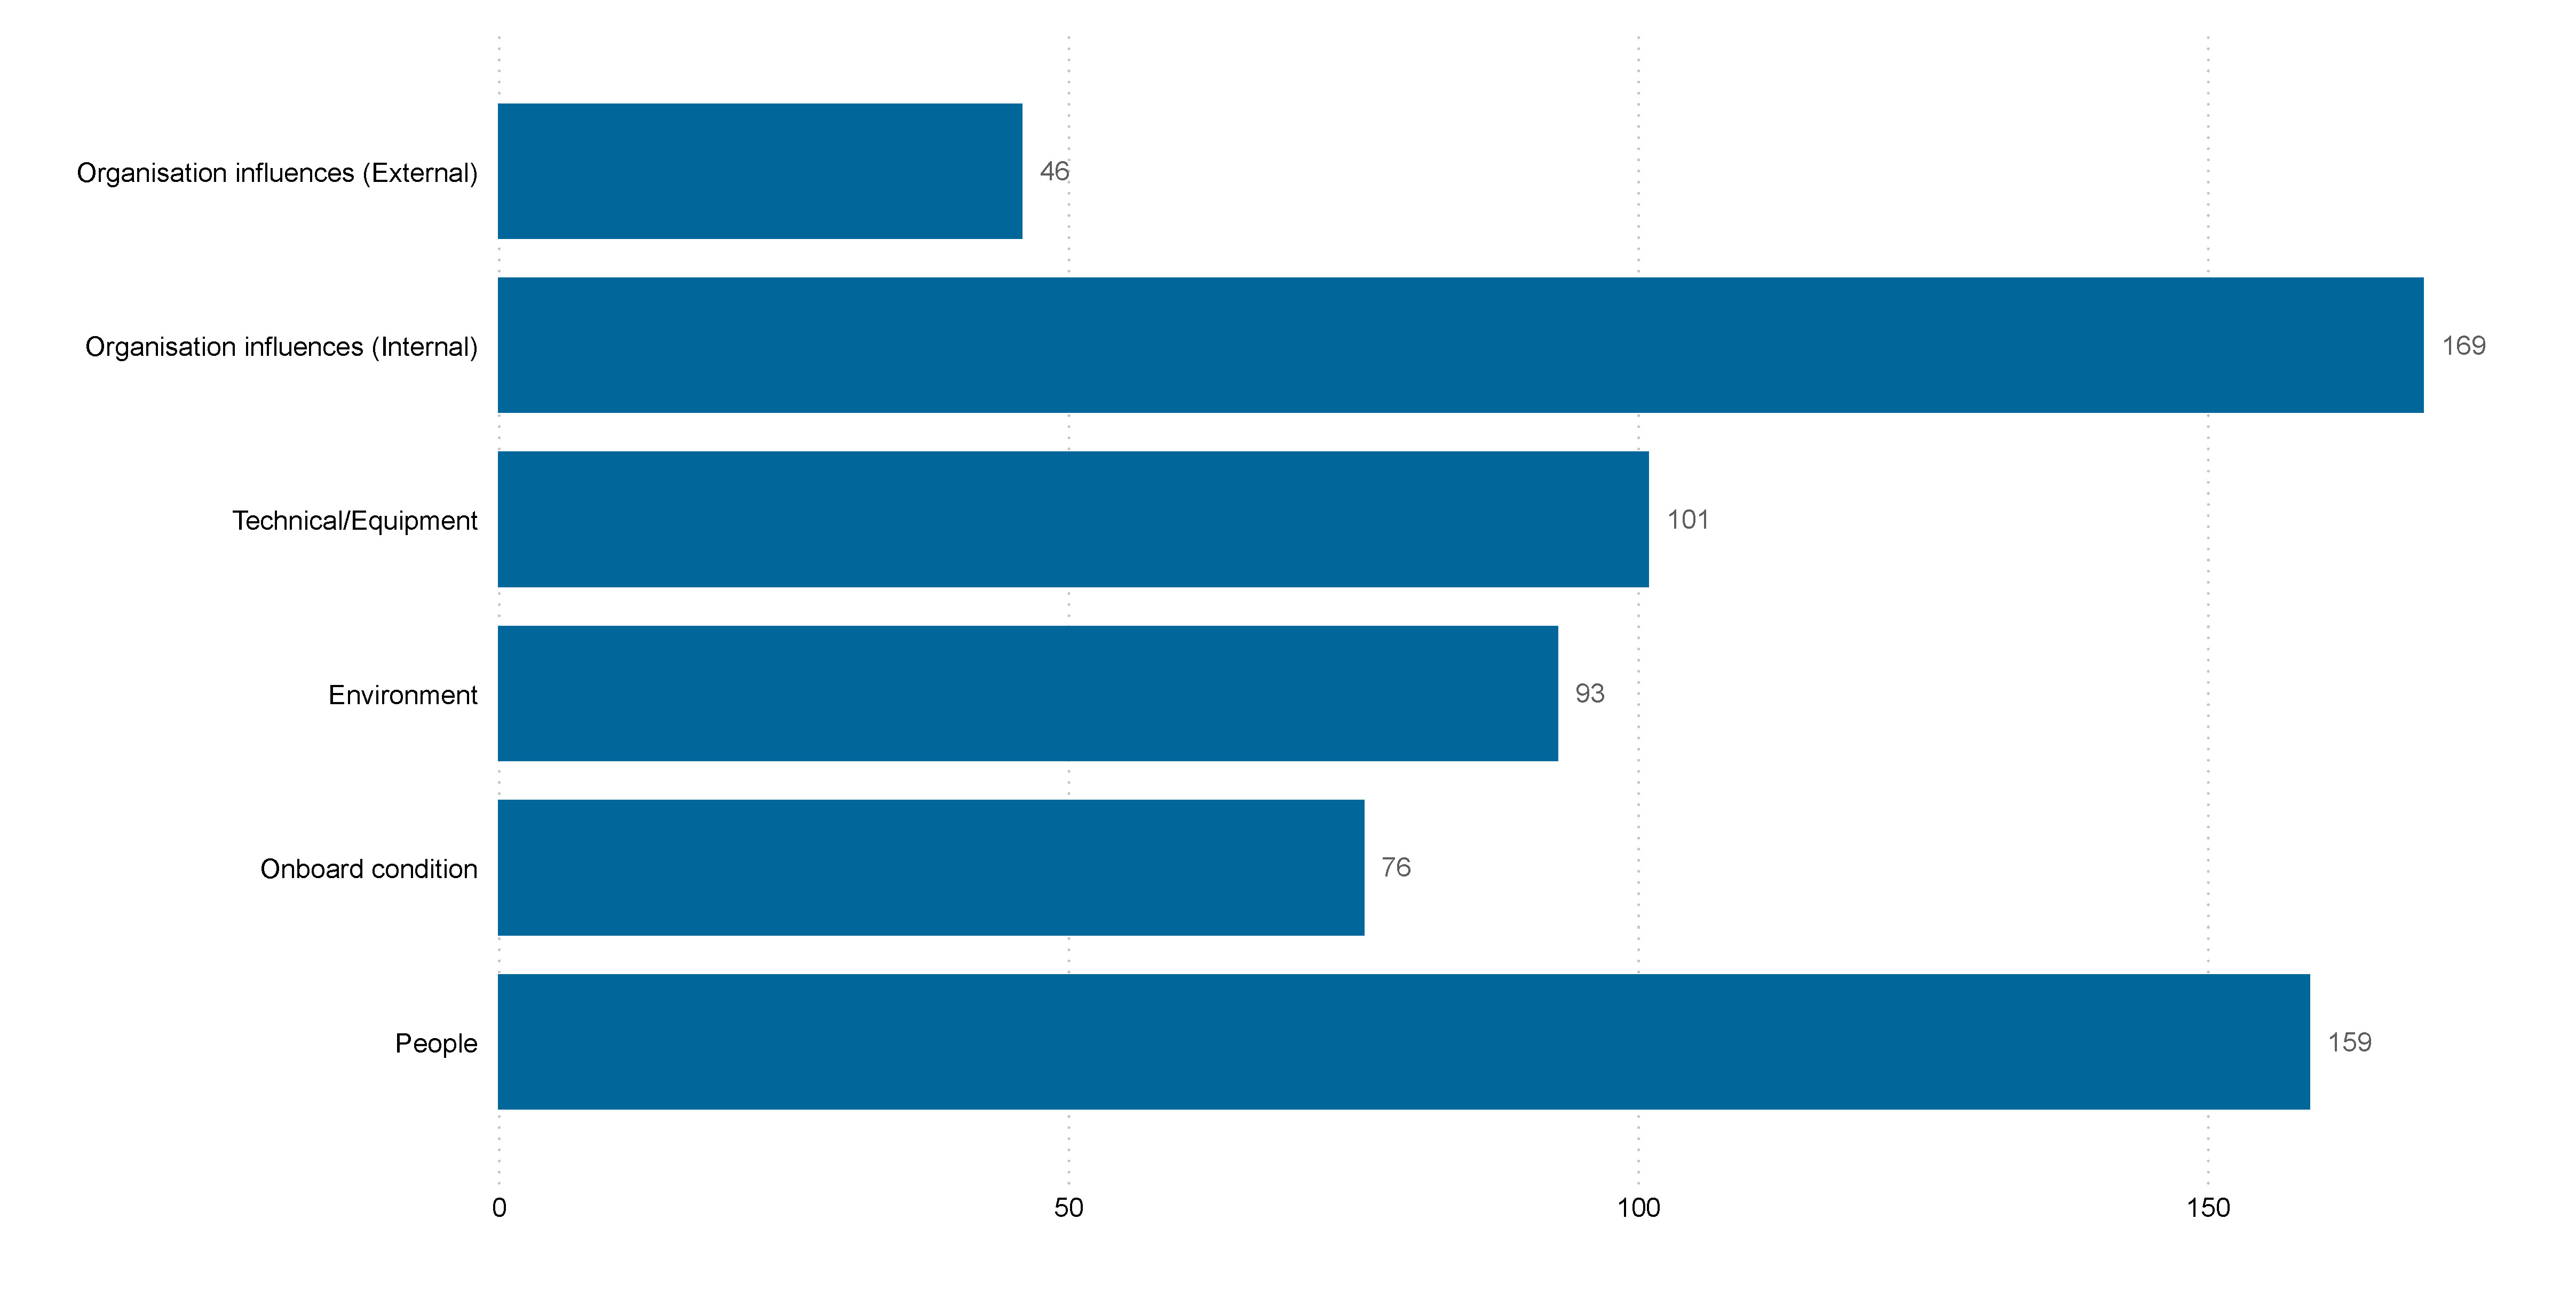
Figure 21 Categorisation of primary safety factors identified from investigation reports (2020-2023).
The analyses presented will focus on the three primary safety factors of concern, people, onboard condition, and organisational influences (internal).
People
People actions refer to observable behaviours such as decisions, actions and/or inaction by the crew that increased risk.
Of the people actions, 38.7% were related to deck, followed by navigation actions at 38.3% (98) and maintenance actions at 13.7% (35) (Figure 22).
Deck Operations comprised shortfalls in using equipment (29.3% (29)), communicating and coordinating (23.3% (23)), assessing and planning (20.2% (20)), and monitoring/checking/documenting (19.2% (19)).
These included poor use of equipment such as winches and cranes, line handling, and vessel fixtures such as gas cookers. Examples of communication and coordinating factors include inability to hear instructions or warnings, failure to set lookouts, and failure to hand over critical information between shifts or crews. Examples of poor assessing and planning include preparing to load cargo, insufficient risk assessment before undertaking work, and continuing to work beyond sunset in poor light.
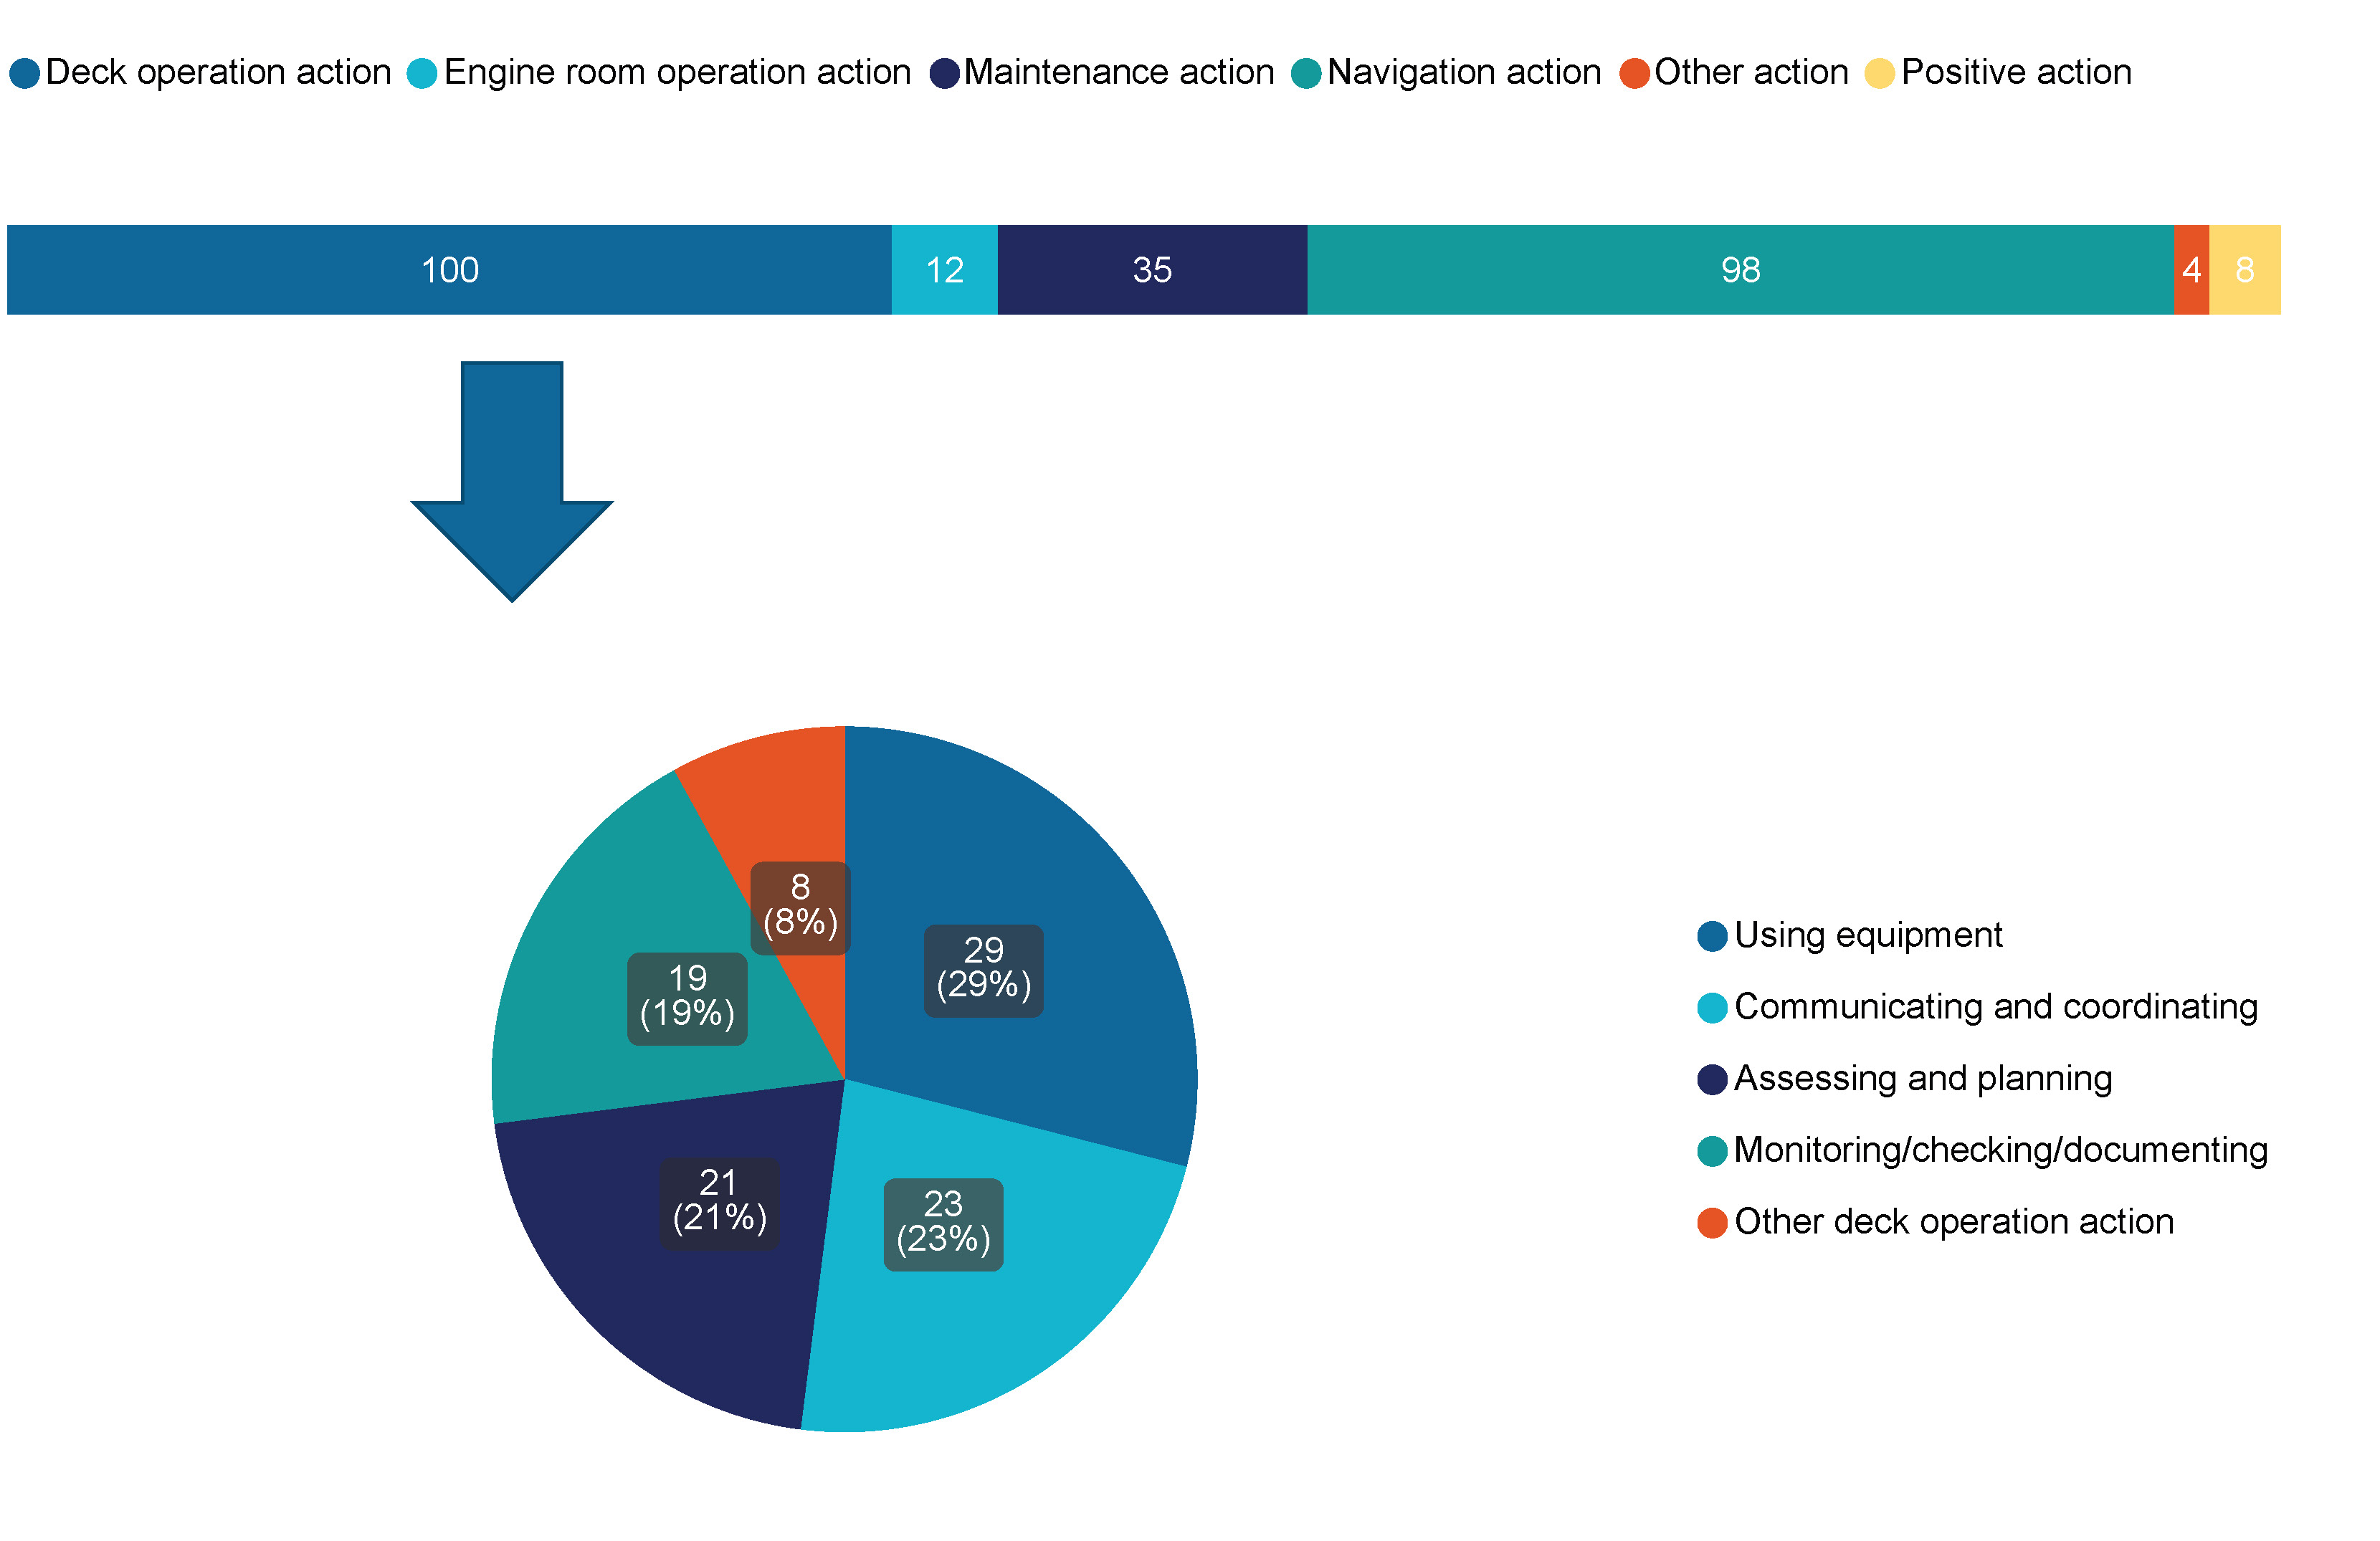
Figure 22 Breakdown of People categories with a focus on deck operations (2020-2023)
Onboard conditions
Onboard conditions refer to aspect onboard the vessel such as knowledge skills and experience, internal and external factors that influence performance and well-being that increase risk.
Most safety factors identified related to onboard conditions included knowledge, skills and experience, (40.2% (43)). This is followed by personal factors (32.7% (35)), task knowledge/skills, equipment knowledge/skills, and task experience (including recency of that experience) (Figure 23).
Knowledge skills and experience included lack of knowledge in the operation of key machinery and safety systems onboard the vessel and in performing key tasks such as anchoring or responding to emergencies.
Shortage of skilled and competent crew are associated with factors including pressure to complete tasks, high workload and fatigue.
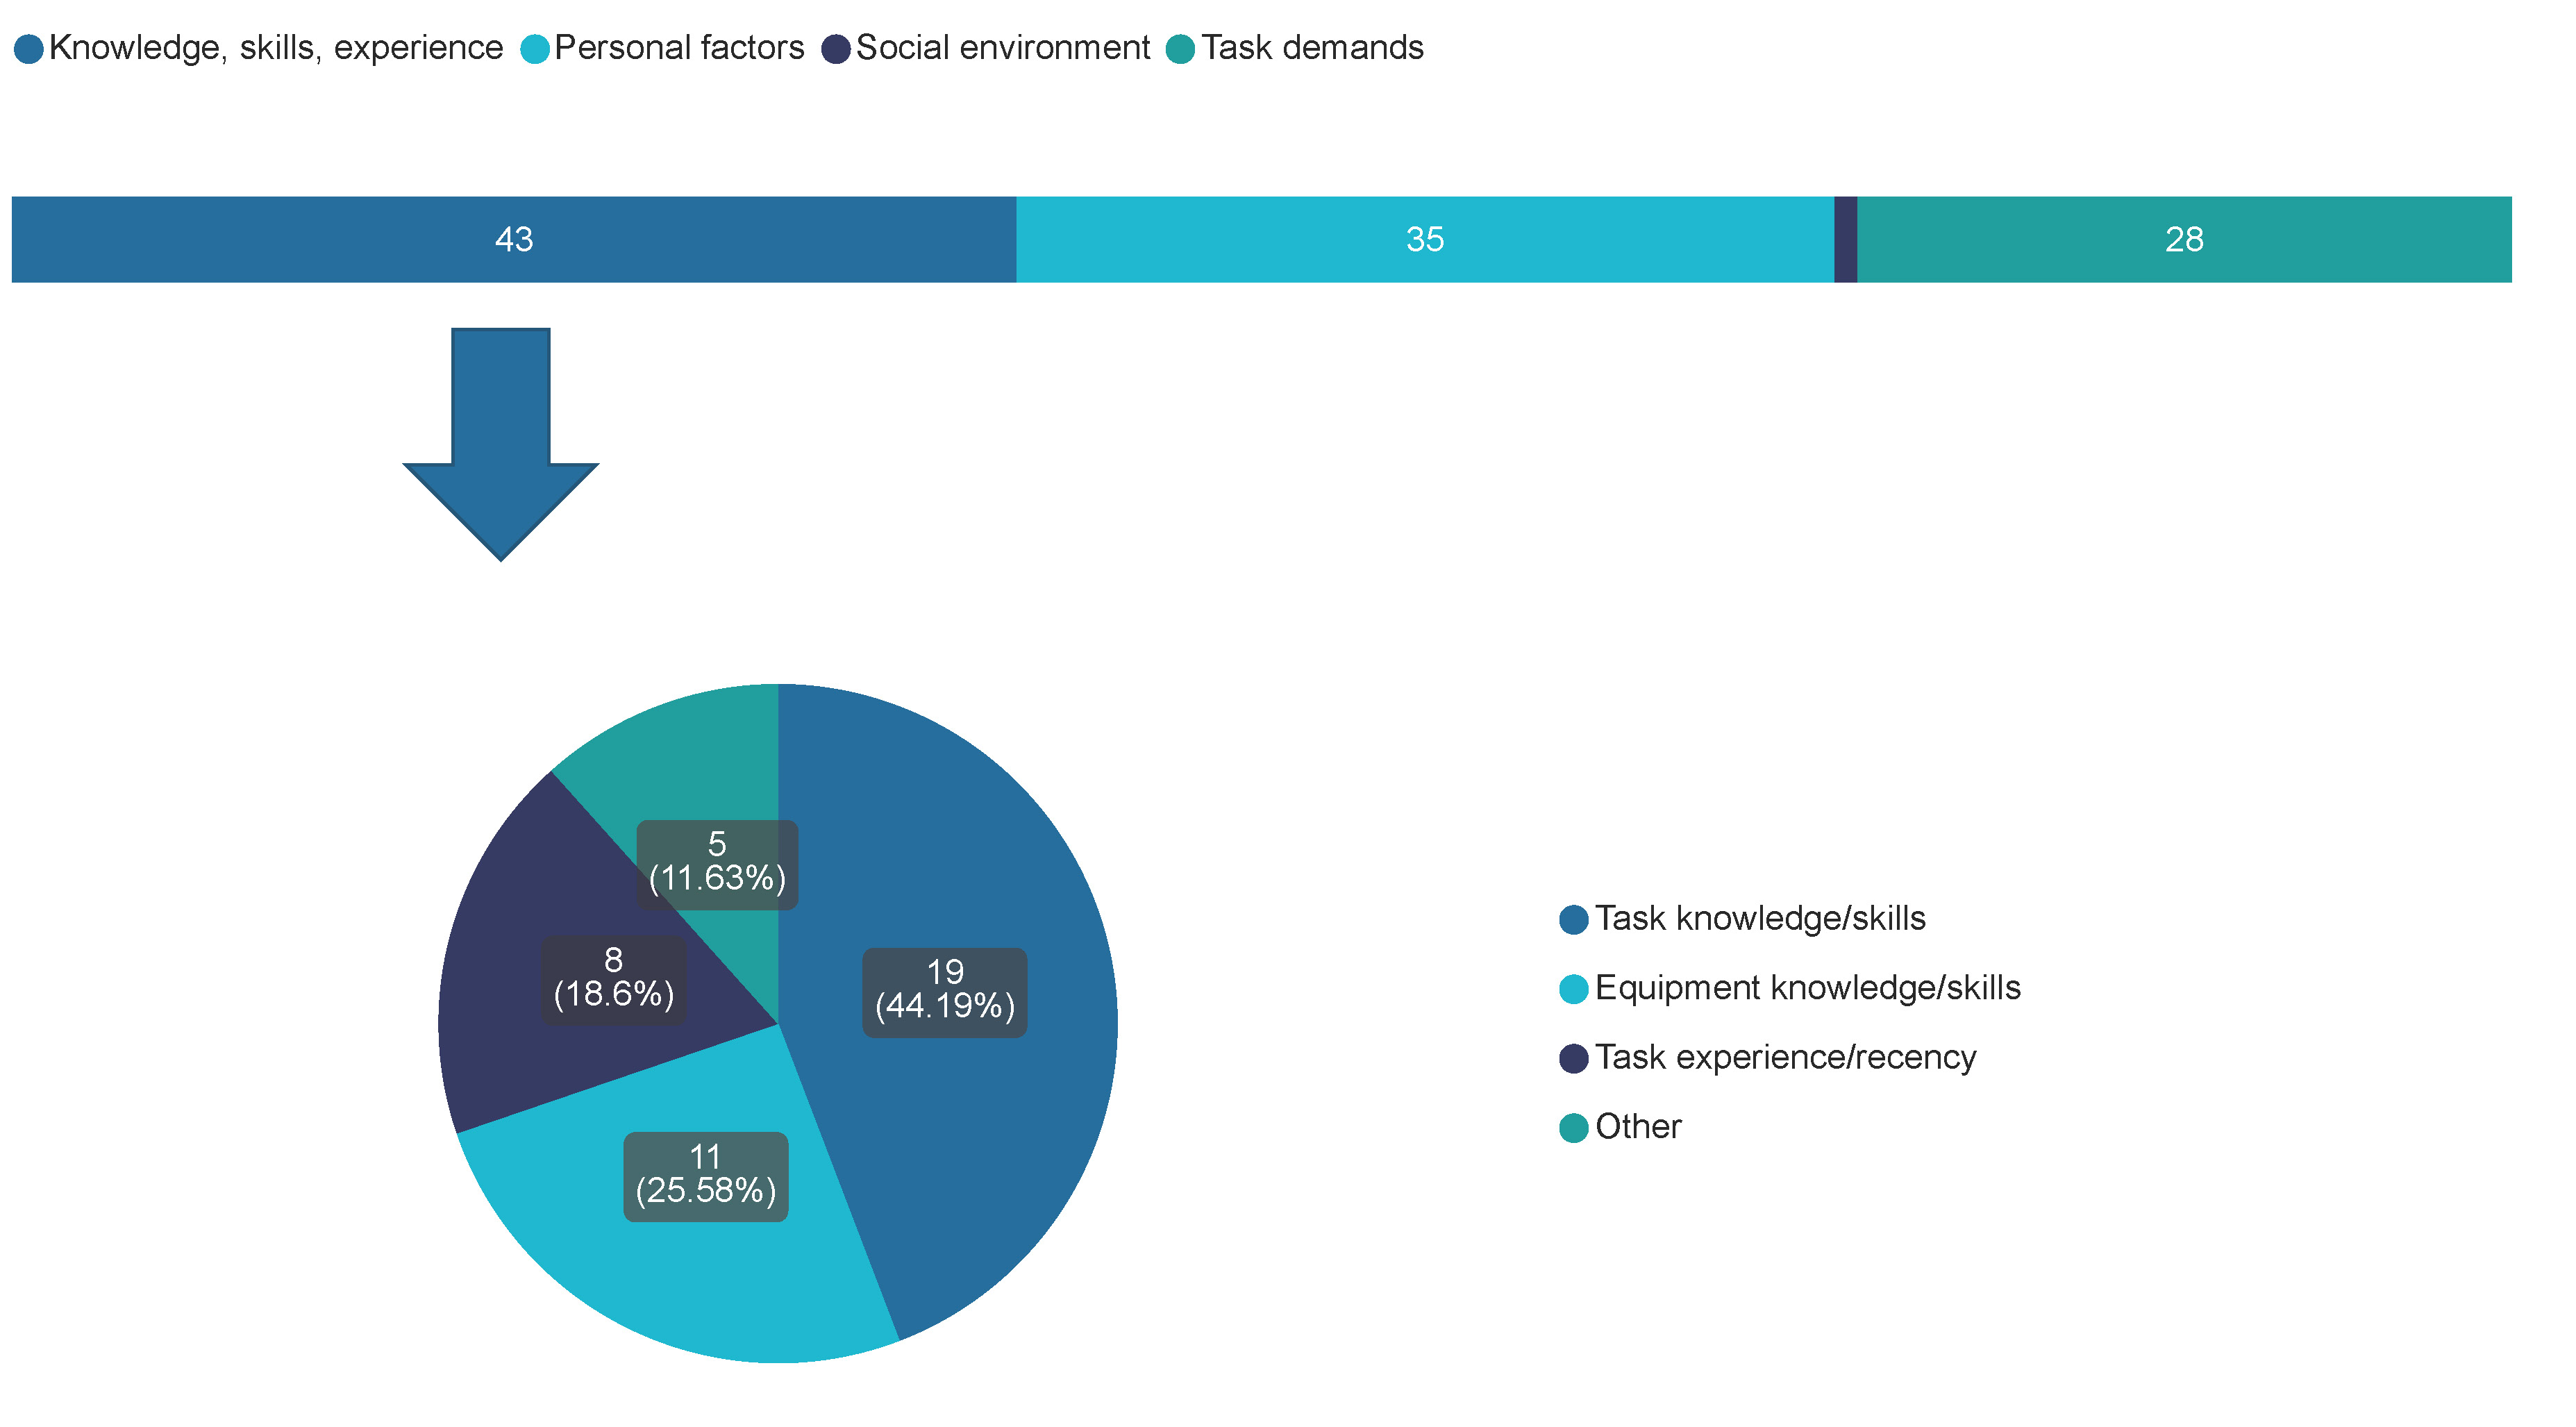
Figure 23 Breakdown of Onboard conditions categories with a focus on Knowledge, skills, experience (2020-2023)
Internal organisational influences
A significant portion of the risks to safety of vessels and crews reside at the organisational level.
Safety management system deficiencies comprise most of the internal organisational issues, at 64.4% (204), followed by people management at 21.5% (68).
Poor, lack of or ineffective risk assessments continue to present a major area of concern and remains a focus of AMSA’s National Compliance Plan. Most safety management system issues are associated with shortfalls in the risk assessment (36.8% (75)) and safety procedures (35.3% (72)) (Figure 24 ).
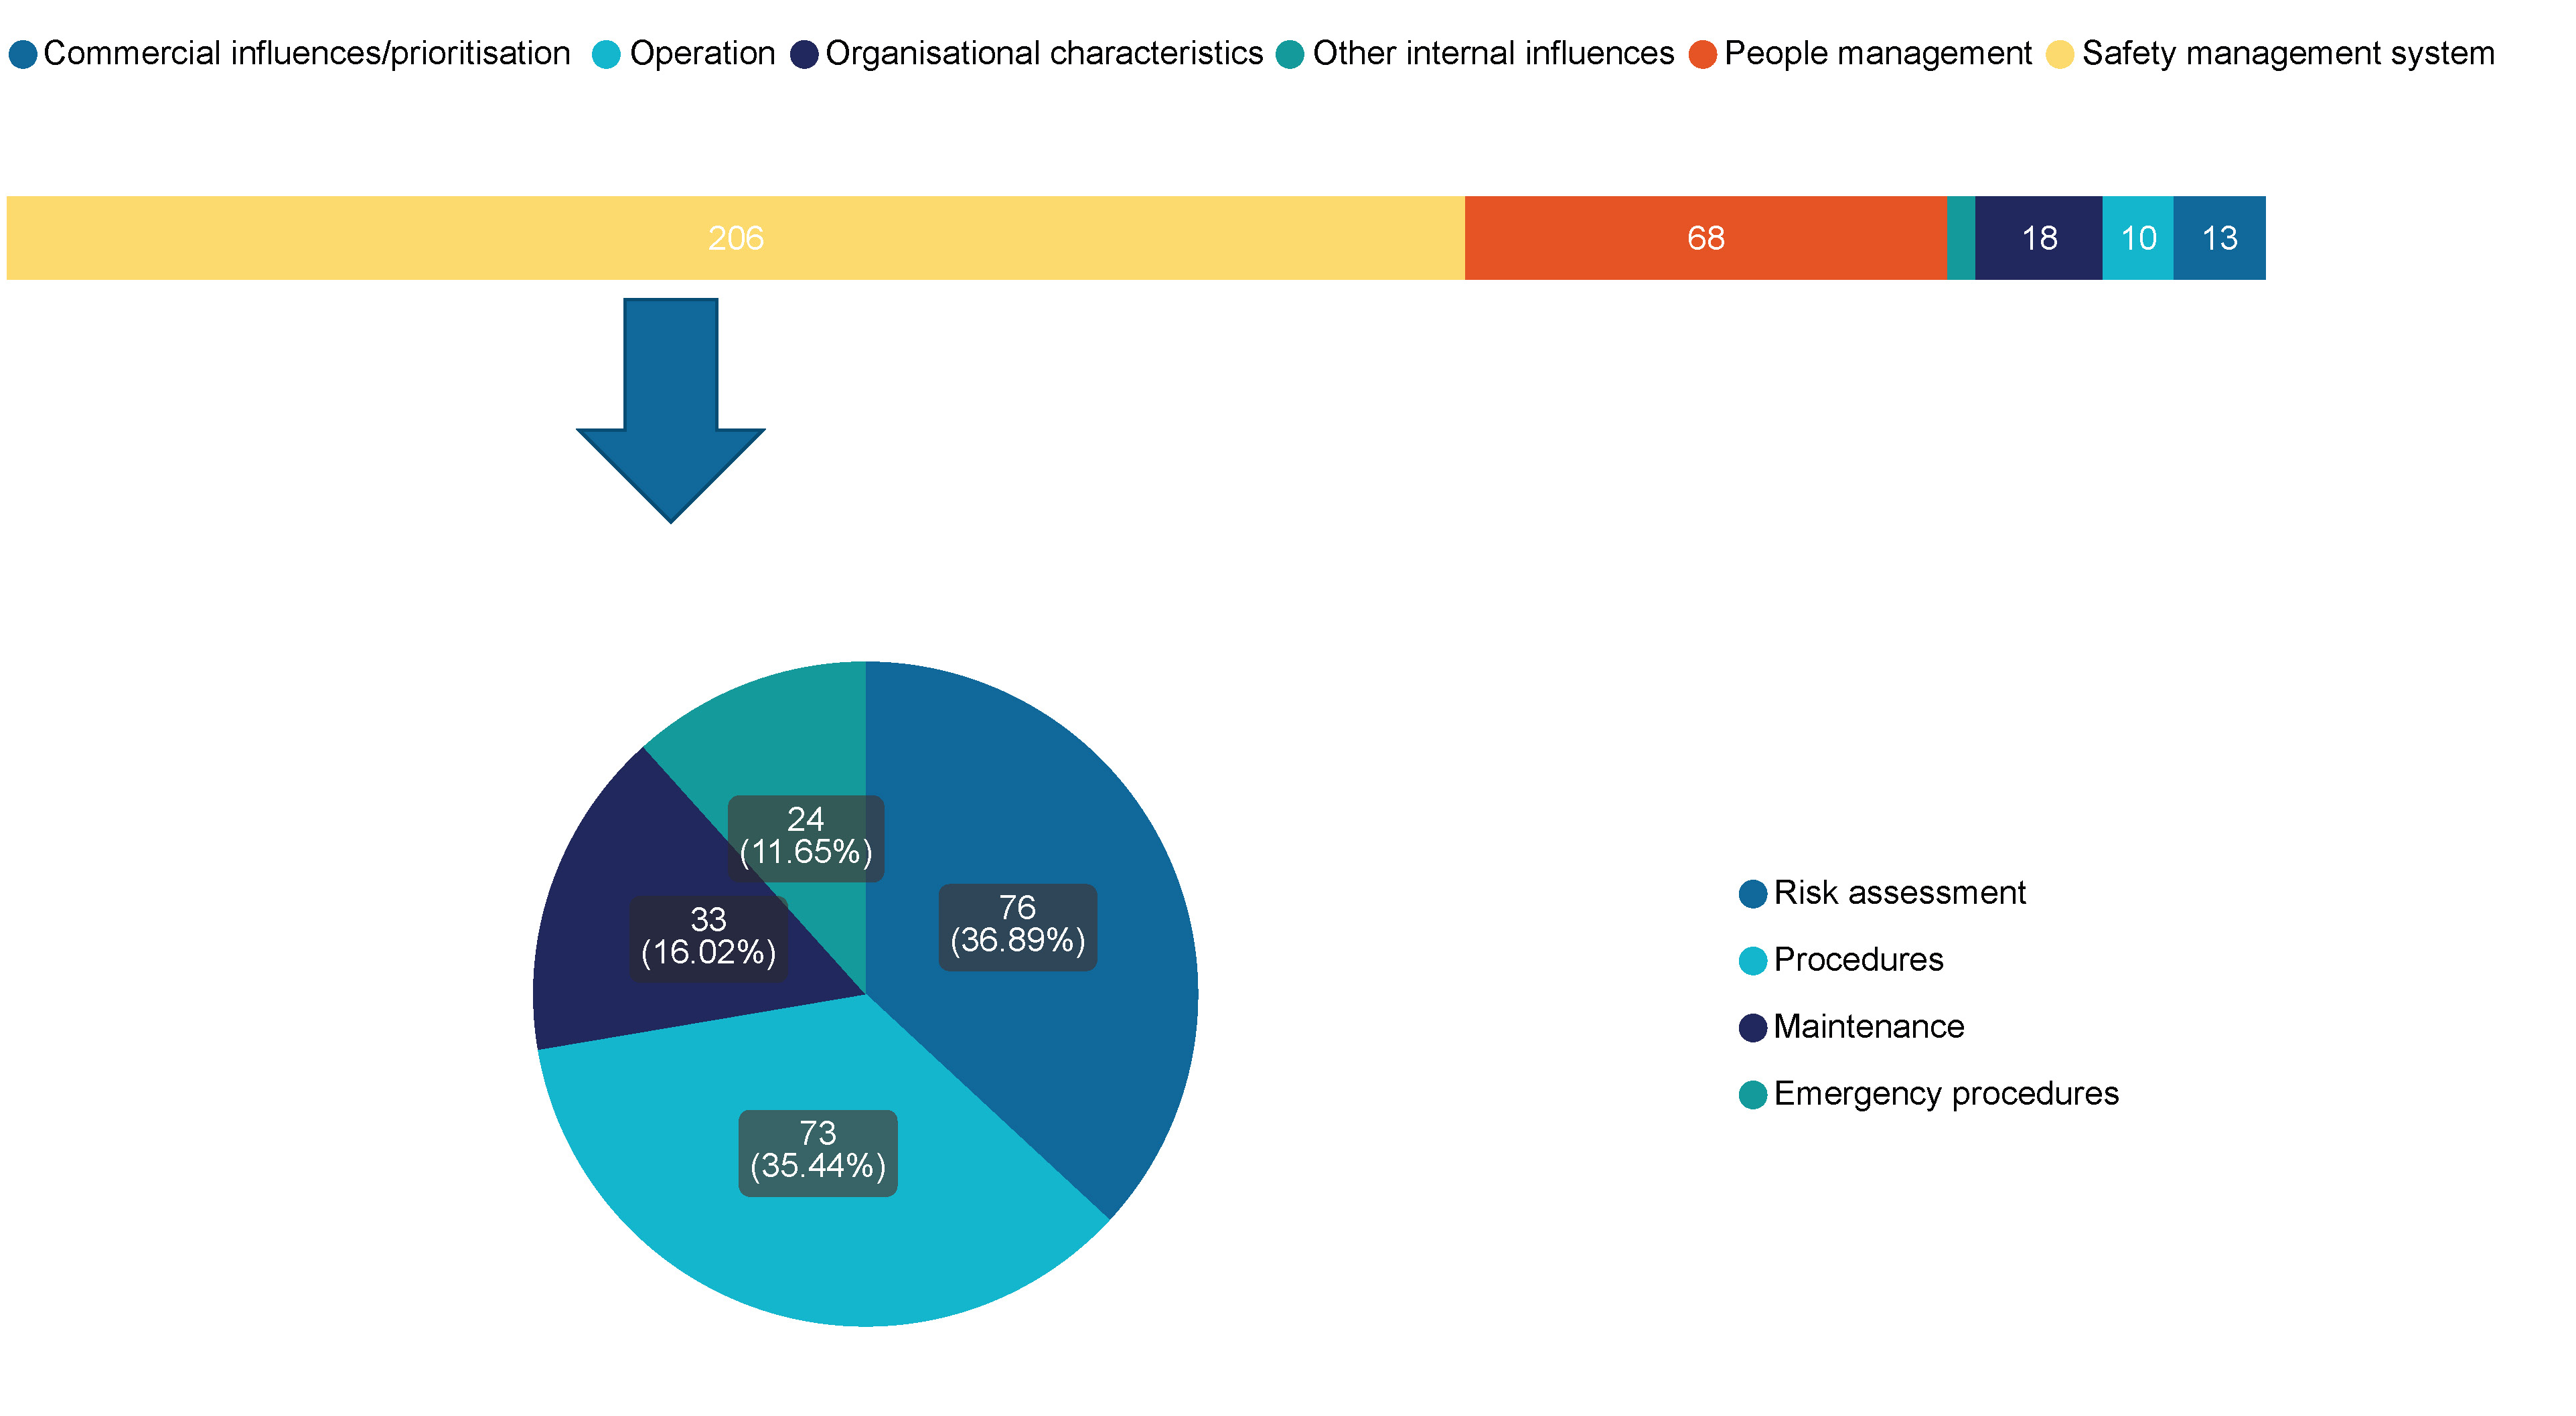
Figure 24 Breakdown of internal organisational categories with a safety management processes (2020-2023)
Footnotes
1 NSCV part B contains the system for categorisation of vessels.
2 The actual number of fatalities must be considered when interpreting the fatality rates for this data due to the difference the size of the respective workforces. As noted in Work-related traumatic injury fatalities Australia 2021by SafeWork Australia, fatality rates are sensitive to the number of people employed in the industry. In smaller industries that employ fewer employees (such as in the DCV fleet), a small variation in the number of fatalities produces an apparent larger variation in the fatality rate.
3Based on a calculated approximation of 66,000 crew engaged on domestic commercial vessels.
42023 statistics from SWA have not been published at the time of writing.
5Safe Work Australia (SWA), Work-related Traumatic Injury Fatalities Australia, 2021, SWA, Government of Australia, 14 November 2022, accessed 6 June 2023.
https://www.safeworkaustralia.gov.au/doc/work-related-traumatic-injury-fatalities-australia-2021; SWA 2023 data not yet available at time of publication of this report.
6All incidents reporting serious operational injuries to crew or passengers are classified as serious.
7 An unintentional departure from the vessel into the water, as opposed to intentionally jumping overboard into the water.
8 Multiple safety framework codes may be applied to a single marine incident.